


文章目录
4.2 带有 go.Sunburst 的基本旭日图
如果Plotly Express 没有提供一个好的起点,也可以使用go.Sunburst(plotly.graph_objects).
要点:
- labels(namesin px.sunburstsincelabels保留用于覆盖列名):设置旭日形扇区的标签。
- parents:设置朝阳扇区的父扇区。空字符串’'用于层次结构中的根节点。在此示例中,根是“Eve”。
- values:设置与旭日形扇区相关的值,确定它们的宽度(有关branchvalues设置宽度的不同模式,请参见下面的部分)。
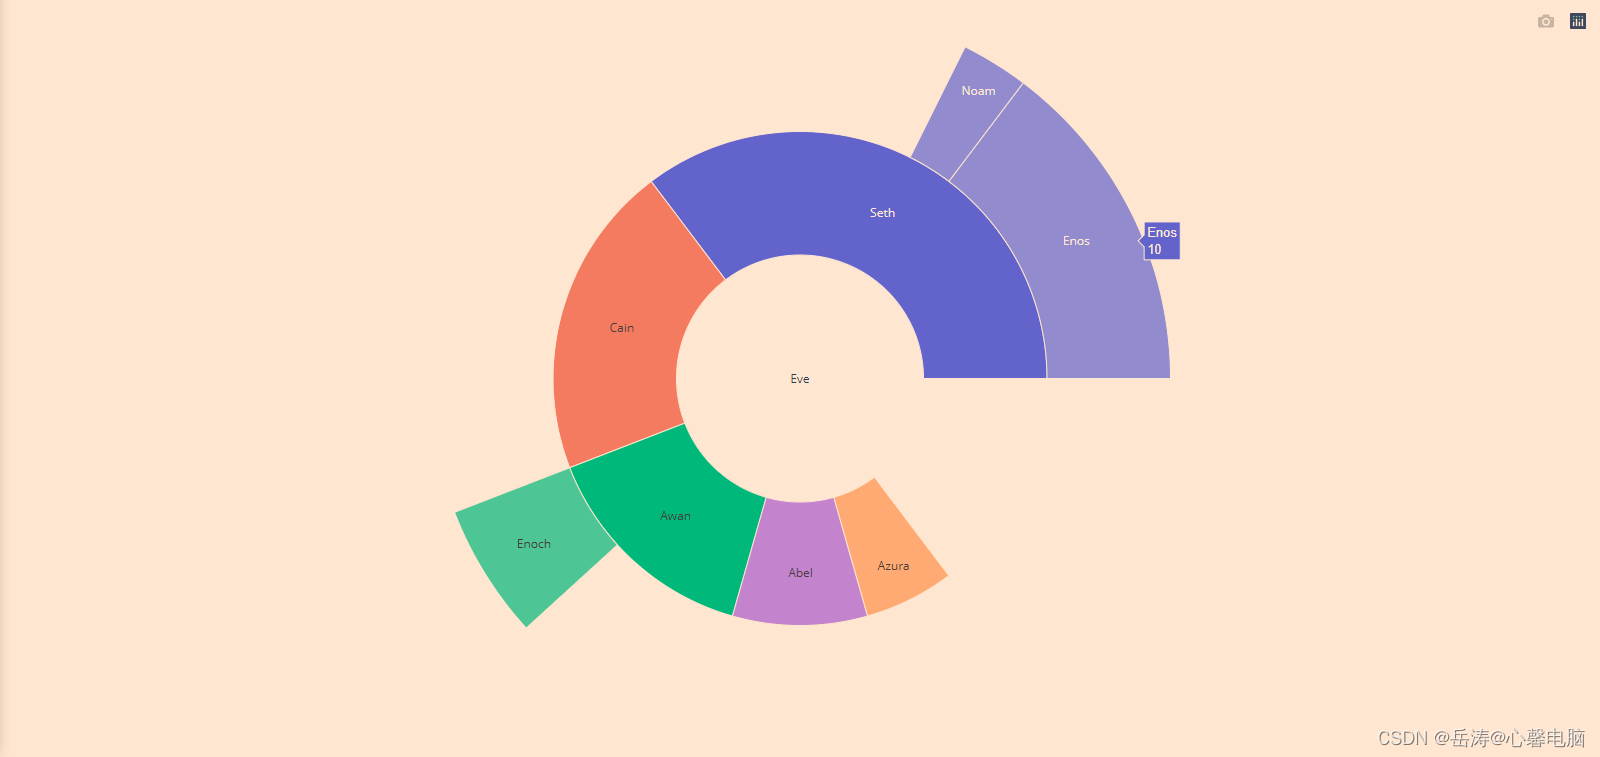
4.2.1 基本go.sunburst()旭日图
import plotly.graph_objects as go

fig =go.Figure(go.Sunburst(
    labels=["Eve", "Cain", "Seth", "Enos", "Noam", "Abel", "Awan", "Enoch", "Azura"],
    parents=["", "Eve", "Eve", "Seth", "Seth", "Eve", "Eve", "Awan", "Eve" ],
    values=[10, 14, 12, 10, 2, 6, 6, 4, 4],
))
# 更新版面,以缩小页边空白
# 参见 https://plotly.com/python/creating-and-updating-figures/
fig.update_layout(margin = dict(t=0, l=0, r=0, b=0))

fig.show()
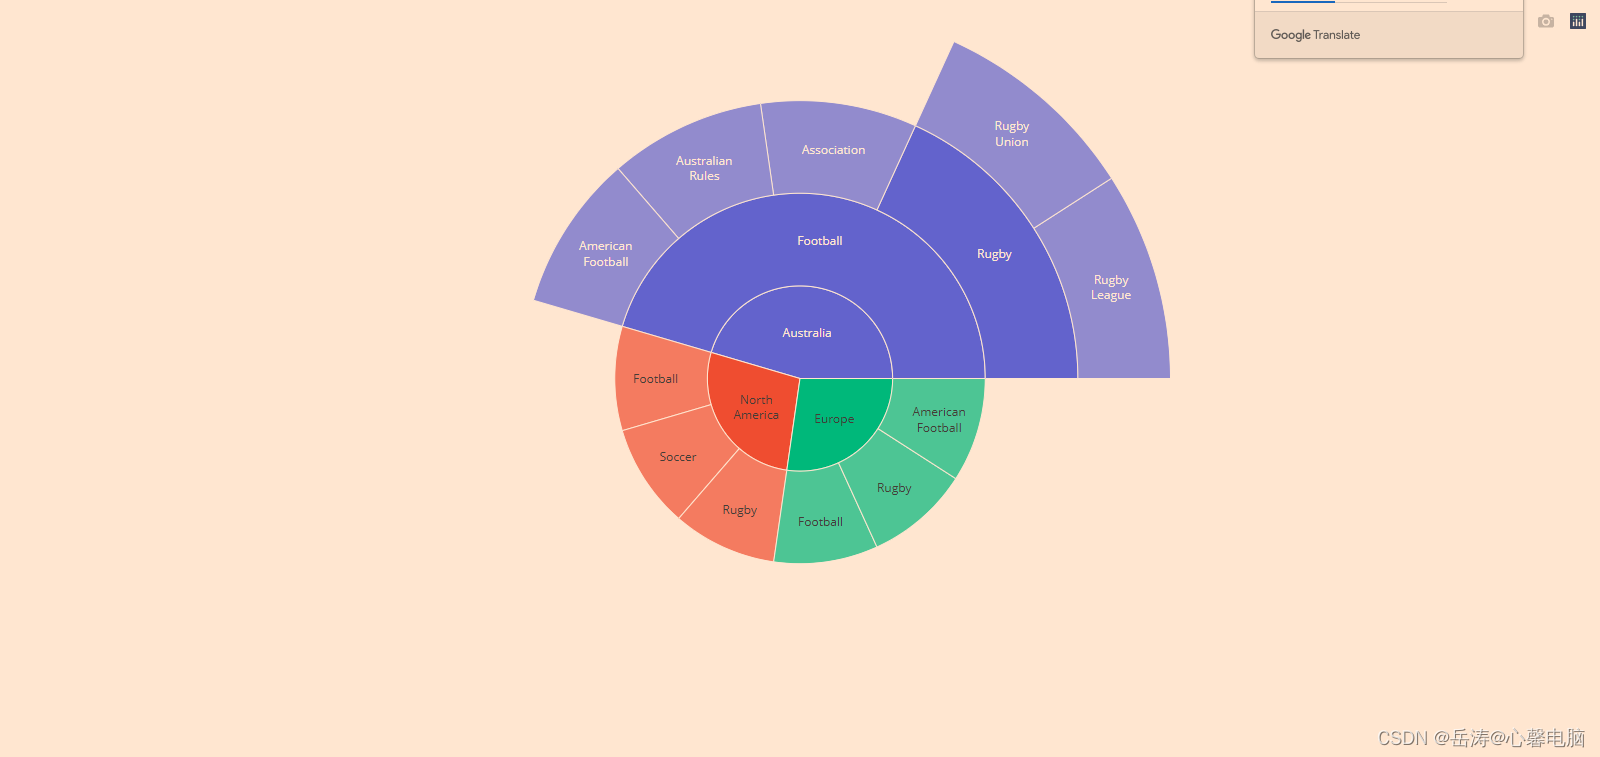
4.2.2 带有重复标签的旭日图
import plotly.graph_objects as go

fig =go.Figure(go.Sunburst(
 ids=[
    "North America", "Europe", "Australia", "North America - Football", "Soccer",
    "North America - Rugby", "Europe - Football", "Rugby",
    "Europe - American Football","Australia - Football", "Association",
    "Australian Rules", "Autstralia - American Football", "Australia - Rugby",
    "Rugby League", "Rugby Union"
  ],
  labels= [
    "North<br>America", "Europe", "Australia", "Football", "Soccer", "Rugby",
    "Football", "Rugby", "American<br>Football", "Football", "Association",
    "Australian<br>Rules", "American<br>Football", "Rugby", "Rugby<br>League",
    "Rugby<br>Union"
  ],
  parents=[
    "", "", "", "North America", "North America", "North America", "Europe",
    "Europe", "Europe","Australia", "Australia - Football", "Australia - Football",
    "Australia - Football", "Australia - Football", "Australia - Rugby",
    "Australia - Rugby"
  ],
))
fig.update_layout(margin = dict(t=0, l=0, r=0, b=0))

fig.show()
4.2.3 分支值
对于分支值“total”,父项的值表示其楔形的宽度。在下面的例子中,“Enoch”是 4,“Awan”是 6,所以 Enoch 的宽度是 Awans 的 4/6。使用分支值“剩余”,父级的宽度由其自身的值加上其子级的值确定。因此,Enoch 的宽度是 Awan (4 / (6 + 4)) 的 4/10。
请注意,这意味着当 branchvalues 设置为“total”时,子项的值之和不能超过其父项的值。当 branchvalues 设置为“remainder”(默认值)时,子级不会占用其父级下方的所有空间(除非父级是根并且其值为 0)。
import plotly.graph_objects as go

fig =go.Figure(go.Sunburst(
    labels=[ "Eve", "Cain", "Seth", "Enos", "Noam", "Abel", "Awan", "Enoch", "Azura"],
    parents=["",    "Eve",  "Eve",  "Seth", "Seth", "Eve",  "Eve",  "Awan",  "Eve" ],
    values=[  65,    14,     12,     10,     2,      6,      6,      4,       4],
    branchvalues="total",
))
fig.update_layout(margin = dict(t=0, l=0, r=0, b=0))

fig.show()

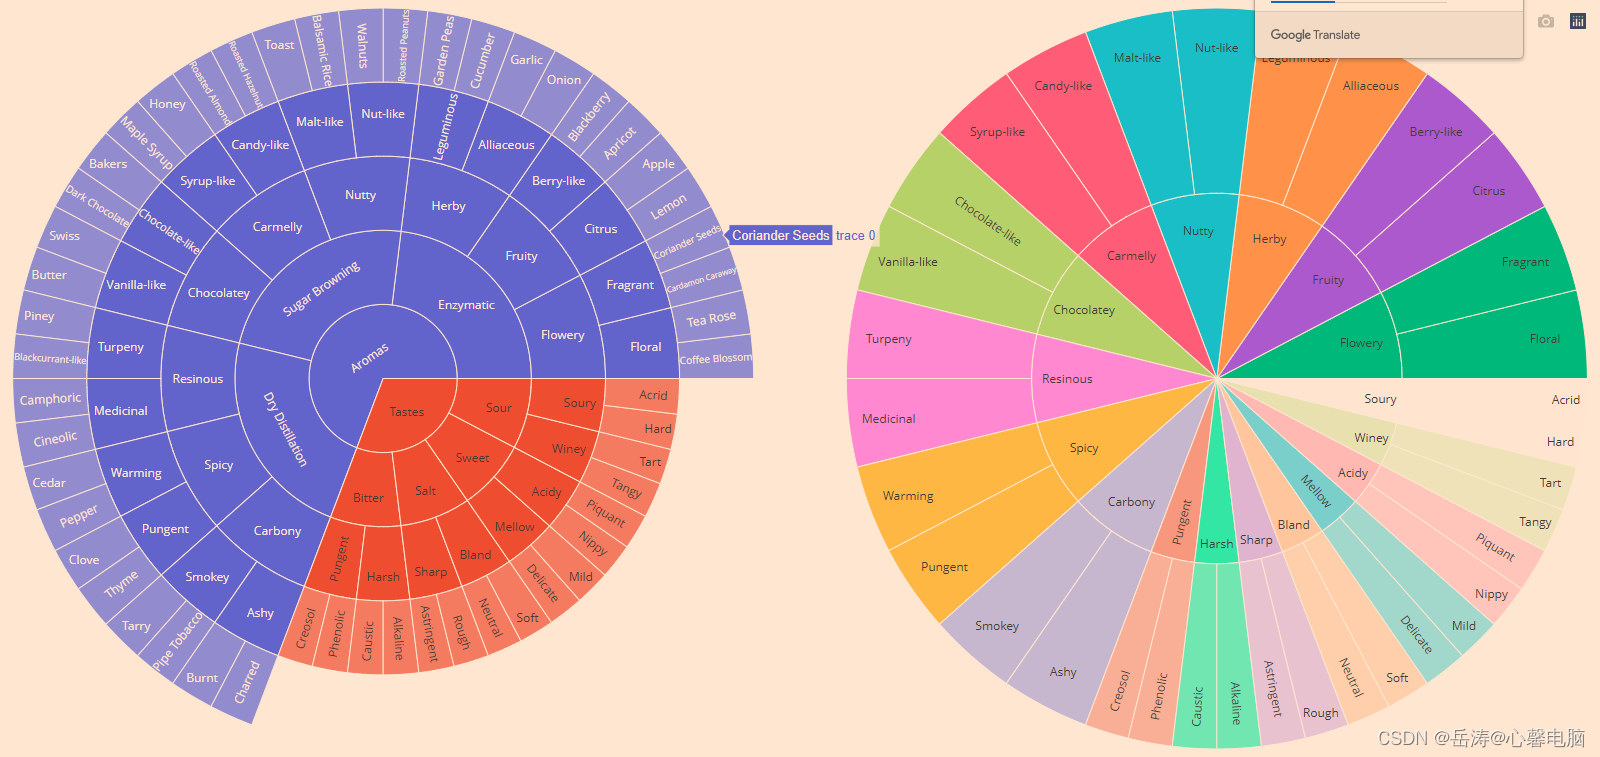
4.2.4 大量切片
此示例对 suplots 使用plotly 网格属性。使用域属性引用行和列目标。
import plotly.graph_objects as go

import pandas as pd
# 'https://raw.githubusercontent.com/plotly/datasets/718417069ead87650b90472464c7565dc8c2cb1c/sunburst-coffee-flavors-complete.csv'
df1 = pd.read_csv('f:/sunburst-coffee-flavors-complete.csv')
print(df1)
'''
                        ids            labels         parents
0                    Aromas            Aromas             NaN
1                    Tastes            Tastes             NaN
2          Aromas-Enzymatic         Enzymatic          Aromas
3     Aromas-Sugar Browning    Sugar Browning          Aromas
4   Aromas-Dry Distillation  Dry Distillation          Aromas
..                      ...               ...             ...
91            Pungent-Thyme             Thyme   Spicy-Pungent
92             Smokey-Tarry             Tarry  Carbony-Smokey
93      Smokey-Pipe Tobacco      Pipe Tobacco  Carbony-Smokey
94               Ashy-Burnt             Burnt    Carbony-Ashy
95             Ashy-Charred           Charred    Carbony-Ashy

[96 rows x 3 columns]
'''
# 'https://raw.githubusercontent.com/plotly/datasets/718417069ead87650b90472464c7565dc8c2cb1c/coffee-flavors.csv'
df2 = pd.read_csv('f:/coffee-flavors.csv')
print(df2)
'''
                        ids        labels         parents
0         Enzymatic-Flowery       Flowery             NaN
1          Enzymatic-Fruity        Fruity             NaN
2           Enzymatic-Herby         Herby             NaN
3      Sugar Browning-Nutty         Nutty             NaN
4   Sugar Browning-Carmelly      Carmelly             NaN
..                      ...           ...             ...
82            Pungent-Thyme         Thyme   Spicy-Pungent
83             Smokey-Tarry         Tarry  Carbony-Smokey
84      Smokey-Pipe Tobacco  Pipe Tobacco  Carbony-Smokey
85               Ashy-Burnt         Burnt    Carbony-Ashy
86             Ashy-Charred       Charred    Carbony-Ashy

[87 rows x 3 columns]
'''
fig = go.Figure()

fig.add_trace(go.Sunburst(
    ids=df1.ids,
    labels=df1.labels,
    parents=df1.parents,
    domain=dict(column=0)
))

fig.add_trace(go.Sunburst(
    ids=df2.ids,
    labels=df2.labels,
    parents=df2.parents,
    domain=dict(column=1),
    maxdepth=2
))

fig.update_layout(
    grid= dict(columns=2, rows=1),
    margin = dict(t=0, l=0, r=0, b=0)
)

fig.show()
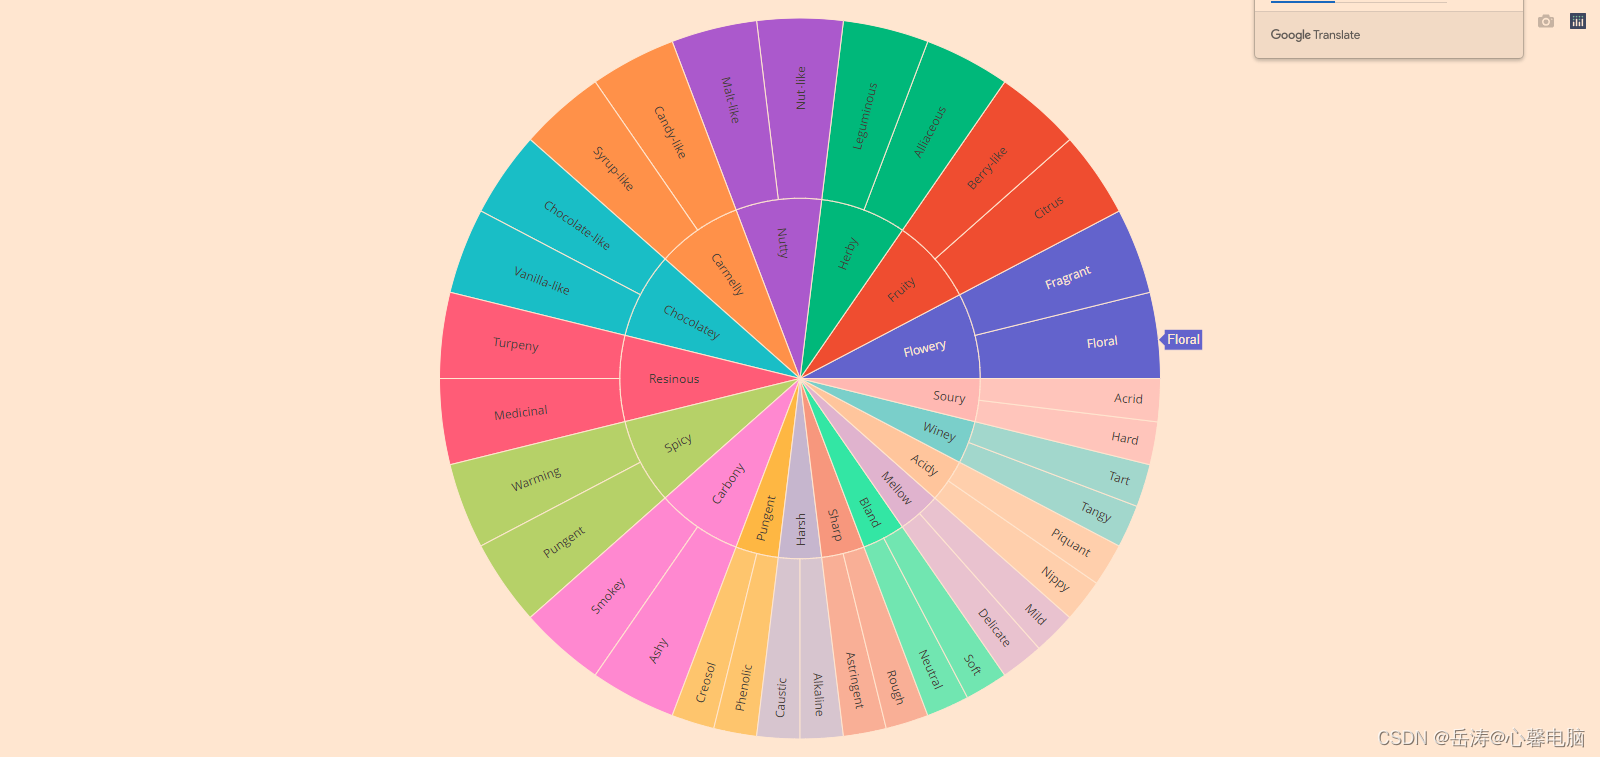
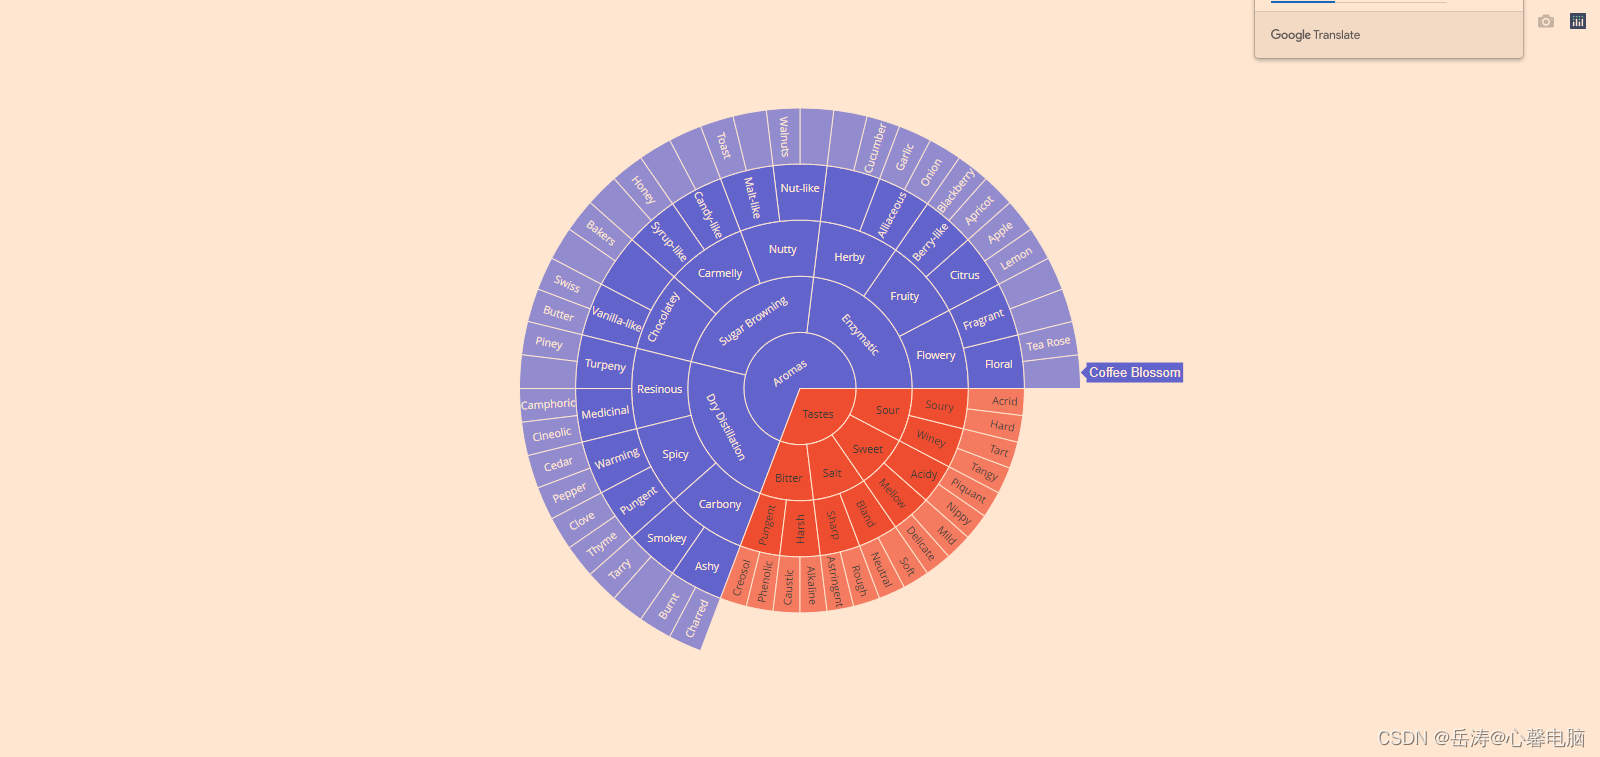
4.2.5 控制旭日形扇区内的文本方向
该insidetextorientation属性控制扇区内文本的方向。使用“自动”,文本可以自动旋转以适应切片内的最大尺寸。使用“水平”(分别是“径向”、“切向”)强制文本是水平的(分别是径向或切向)。请注意,plotly可能会减小字体大小以使文本符合请求的方向。
对于fig使用 plotly express 创建的图形,用于fig.update_traces(insidetextorientation=‘…’)更改文本方向。
import plotly.graph_objects as go

import pandas as pd

# 'https://raw.githubusercontent.com/plotly/datasets/718417069ead87650b90472464c7565dc8c2cb1c/coffee-flavors.csv'
df = pd.read_csv('f:/coffee-flavors.csv')
print(df)
'''
                        ids        labels         parents
0         Enzymatic-Flowery       Flowery             NaN
1          Enzymatic-Fruity        Fruity             NaN
2           Enzymatic-Herby         Herby             NaN
3      Sugar Browning-Nutty         Nutty             NaN
4   Sugar Browning-Carmelly      Carmelly             NaN
..                      ...           ...             ...
82            Pungent-Thyme         Thyme   Spicy-Pungent
83             Smokey-Tarry         Tarry  Carbony-Smokey
84      Smokey-Pipe Tobacco  Pipe Tobacco  Carbony-Smokey
85               Ashy-Burnt         Burnt    Carbony-Ashy
86             Ashy-Charred       Charred    Carbony-Ashy

[87 rows x 3 columns]
'''
fig = go.Figure()

fig.add_trace(go.Sunburst(
    ids=df.ids,
    labels=df.labels,
    parents=df.parents,
    domain=dict(column=1),
    maxdepth=2,
    insidetextorientation='radial'
))

fig.update_layout(
    margin = dict(t=10, l=10, r=10, b=10)
)

fig.show()
4.2.6 使用 uniformtext 控制文本字体大小
如果您希望所有文本标签具有相同的大小,可以使用uniformtextlayout 参数。该minsize属性设置字体大小,该mode属性设置不适合所需字体大小的标签会发生什么:hide它们或show溢出的标签。
注意:动画过渡当前在uniformtext使用时没有实现。
import plotly.graph_objects as go
import pandas as pd

# 'https://raw.githubusercontent.com/plotly/datasets/718417069ead87650b90472464c7565dc8c2cb1c/sunburst-coffee-flavors-complete.csv'
df = pd.read_csv('f:/sunburst-coffee-flavors-complete.csv')
print(df)
'''
                        ids            labels         parents
0                    Aromas            Aromas             NaN
1                    Tastes            Tastes             NaN
2          Aromas-Enzymatic         Enzymatic          Aromas
3     Aromas-Sugar Browning    Sugar Browning          Aromas
4   Aromas-Dry Distillation  Dry Distillation          Aromas
..                      ...               ...             ...
91            Pungent-Thyme             Thyme   Spicy-Pungent
92             Smokey-Tarry             Tarry  Carbony-Smokey
93      Smokey-Pipe Tobacco      Pipe Tobacco  Carbony-Smokey
94               Ashy-Burnt             Burnt    Carbony-Ashy
95             Ashy-Charred           Charred    Carbony-Ashy

[96 rows x 3 columns]
'''

fig = go.Figure(go.Sunburst(
        ids = df.ids,
        labels = df.labels,
        parents = df.parents))
fig.update_layout(uniformtext=dict(minsize=10, mode='hide'))
fig.show()
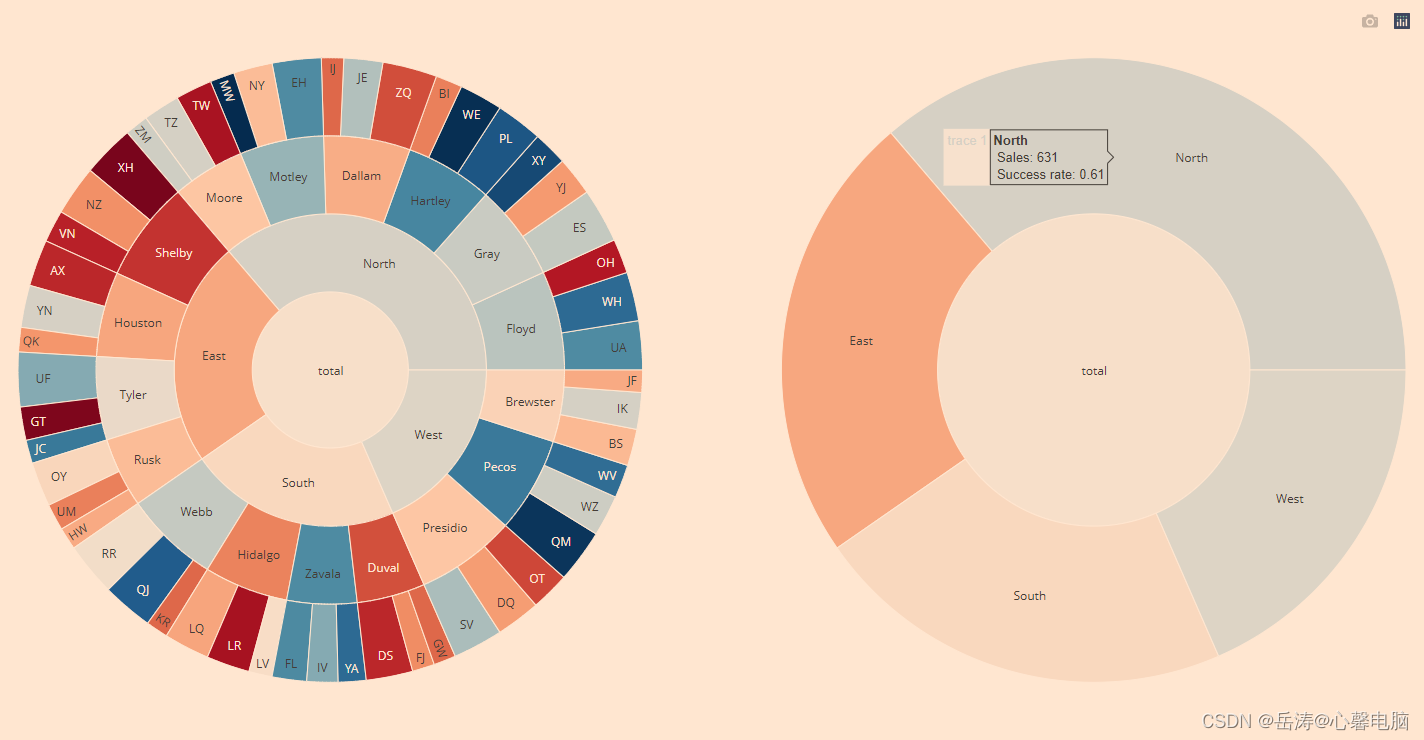
4.2.7 具有连续色标的旭日图
下面的示例显示了按地区、县和销售人员级别划分的销售明细(对应于部门宽度)和呼叫成功率(对应于部门颜色)。例如,在探索数据时,您可以看到虽然东部地区表现不佳,但泰勒县仍然高于平均水平——但是,由于销售人员 GT 的成功率低,其表现有所下降。
在具有两个级别的右侧子图中maxdepth,单击一个扇区以查看其细分到较低级别。
import plotly.graph_objects as go
from plotly.subplots import make_subplots
import pandas as pd
# 'https://raw.githubusercontent.com/plotly/datasets/master/sales_success.csv'
df = pd.read_csv('f:/sales_success.csv')
print(df)
'''
    Unnamed: 0 region    county salesperson  calls  sales
0            0  North    Dallam          JE     35     23
1            1  North    Dallam          ZQ     49     13
2            2  North    Dallam          IJ     20      6
3            3  North   Hartley          WE     39     37
4            4  North   Hartley          PL     42     37
5            5  North   Hartley          BI     24      8
6            6  North     Moore          TW     33      6
7            7  North     Moore          TZ     33     20
8            8  North     Moore          ZM     21     13
9            9  North      Gray          ES     49     31
10          10  North      Gray          XY     31     28
11          11  North      Gray          YJ     35     13
12          12  North     Floyd          WH     44     37
13          13  North     Floyd          OH     31      6
14          14  North     Floyd          UA     44     34
15          15  North    Motley          EH     44     34
16          16  North    Motley          MW     22     21
17          17  North    Motley          NY     35     15
18          18   West     Pecos          WV     30     25
19          19   West     Pecos          QM     48     45
20          20   West     Pecos          WZ     37     23
21          21   West  Brewster          IK     33     20
22          22   West  Brewster          BS     33     14
23          23   West  Brewster          JF     20      8
24          24   West  Presidio          DQ     40     15
25          25   West  Presidio          OT     35      9
26          26   West  Presidio          SV     45     30
27          27  South      Webb          KR     20      6
28          28  South      Webb          QJ     46     40
29          29  South      Webb          RR     48     26
30          30  South     Duval          FJ     20      7
31          31  South     Duval          GW     20      6
32          32  South     Duval          DS     42      9
33          33  South   Hidalgo          LQ     41     16
34          34  South   Hidalgo          LR     39      7
35          35  South   Hidalgo          LV     21     11
36          36  South    Zavala          YA     25     21
37          37  South    Zavala          FL     31     24
38          38  South    Zavala          IV     28     20
39          39   East    Shelby          NZ     45     16
40          40   East    Shelby          VN     29      6
41          41   East    Shelby          XH     47      6
42          42   East      Rusk          HW     20      8
43          43   East      Rusk          UM     24      8
44          44   East      Rusk          OY     40     20
45          45   East     Tyler          JC     21     17
46          46   East     Tyler          GT     30      4
47          47   East     Tyler          UF     49     35
48          48   East   Houston          QK     22      8
49          49   East   Houston          AX     42      9
50          50   East   Houston          YN     38     23
'''
levels = ['salesperson', 'county', 'region'] # levels used for the hierarchical chart
color_columns = ['sales', 'calls']
value_column = 'calls'

def build_hierarchical_dataframe(df, levels, value_column, color_columns=None):
    """
    Build a hierarchy of levels for Sunburst or Treemap charts.

    Levels are given starting from the bottom to the top of the hierarchy,
    ie the last level corresponds to the root.
    """
    df_all_trees = pd.DataFrame(columns=['id', 'parent', 'value', 'color'])
    for i, level in enumerate(levels):
        df_tree = pd.DataFrame(columns=['id', 'parent', 'value', 'color'])
        dfg = df.groupby(levels[i:]).sum()
        dfg = dfg.reset_index()
        df_tree['id'] = dfg[level].copy()
        if i < len(levels) - 1:
            df_tree['parent'] = dfg[levels[i+1]].copy()
        else:
            df_tree['parent'] = 'total'
        df_tree['value'] = dfg[value_column]
        df_tree['color'] = dfg[color_columns[0]] / dfg[color_columns[1]]
        df_all_trees = df_all_trees.append(df_tree, ignore_index=True)
    total = pd.Series(dict(id='total', parent='',
                              value=df[value_column].sum(),
                              color=df[color_columns[0]].sum() / df[color_columns[1]].sum()))
    df_all_trees = df_all_trees.append(total, ignore_index=True)
    return df_all_trees


df_all_trees = build_hierarchical_dataframe(df, levels, value_column, color_columns)
average_score = df['sales'].sum() / df['calls'].sum()

fig = make_subplots(1, 2, specs=[[{"type": "domain"}, {"type": "domain"}]],)

fig.add_trace(go.Sunburst(
    labels=df_all_trees['id'],
    parents=df_all_trees['parent'],
    values=df_all_trees['value'],
    branchvalues='total',
    marker=dict(
        colors=df_all_trees['color'],
        colorscale='RdBu',
        cmid=average_score),
    hovertemplate='<b>%{label} </b> <br> Sales: %{value}<br> Success rate: %{color:.2f}',
    name=''
    ), 1, 1)

fig.add_trace(go.Sunburst(
    labels=df_all_trees['id'],
    parents=df_all_trees['parent'],
    values=df_all_trees['value'],
    branchvalues='total',
    marker=dict(
        colors=df_all_trees['color'],
        colorscale='RdBu',
        cmid=average_score),
    hovertemplate='<b>%{label} </b> <br> Sales: %{value}<br> Success rate: %{color:.2f}',
    maxdepth=2
    ), 1, 2)

fig.update_layout(margin=dict(t=10, b=10, r=10, l=10))
fig.show()
4.2.8 Dash中的go.sunburst()
import plotly.graph_objects as go # or plotly.express as px
fig = go.Figure() # or any Plotly Express function e.g. px.bar(...)
# fig.add_trace( ... )
# fig.update_layout( ... )

import dash
import dash_core_components as dcc
import dash_html_components as html

app = dash.Dash()
app.layout = html.Div([
    dcc.Graph(figure=fig)
])

app.run_server(debug=True, use_reloader=False)  # Turn off reloader if inside Jupyter


 5万+
5万+


 被折叠的 条评论
为什么被折叠?
被折叠的 条评论
为什么被折叠?
 到【灌水乐园】发言


