


基于cProfile统计函数级的时延,生成排序列表、火焰图,可以快速定位python代码的耗时瓶颈。参考如下博文结合实操,总结为三步:
mport cProfile, pstats, io

pr = cProfile.Profile()
pr.enable()

#start your code


#end your code
pr.disable()
pr.dump("./test.prof")
2. 统计时延分布列表:
import pstats
profiler = pstats.Stats('test.prof')
profiler.strip_dirs()
profiler.sort_stats('cumulative')
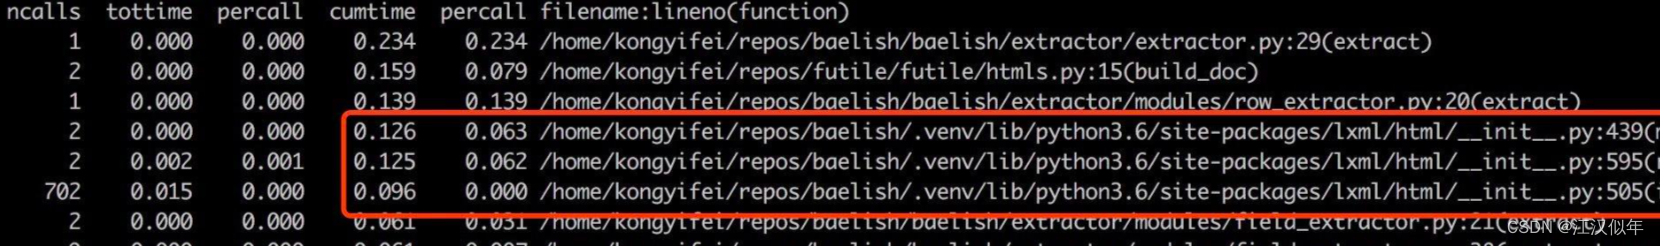
profiler.print_stats()
效果如下图:
3. 生成火焰图
安装工具:pip3 install flameprof
运行:flameprof test.prof > test.svg


 715
715


 被折叠的 条评论
为什么被折叠?
被折叠的 条评论
为什么被折叠?
 到【灌水乐园】发言


