


python语言abs() 函数返回数字的绝对值。
import numpy as np
np.shape(数组)[0]
import numpy as np
a=np.array([[1,2,3],[2,4,5]])
a
<<<<array([[1, 2, 3],
       [2, 4, 5]])
np.shape(a)
<<<(2, 3)
np.shape(a)[0]   #需要显示行
<<<   2
np.shape(a)[1]    #需要显示列
<<<   3
fig.add_subplot(xyz)
x表示行,y表示列,z表示位置
fig = plt.figure(figsize = (5,5)) 表明画图空间5x5
ax = fig.add_subplot(223)则表示把5x5的图片切分2行2列的小方格(共有4小格),在第三个格里画图。
import matplotlib.pyplot as plt
fig = plt.figure(figsize = (5,5))
#ax = fig.add_subplot(222)
#ax = fig.add_subplot(222)
#ax = fig.add_subplot(223)
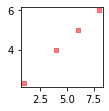
ax = fig.add_subplot(332)
xcord1=[1,4,6,8]
ycord1=[2.3,4,5,6]
ax.scatter(xcord1, ycord1, s = 20, c = 'red', marker = 's',alpha=.5)
plt.show()
np.mat()用法
m= np.mat([1,2,3])
m
<<<matrix([[1, 2, 3]])
m[0,1]              #第一行,第2个数据
<<<<  2
m[0][1]             #注意不能像数组那样取值了
<<<IndexError: index 1 is out of bounds for axis 0 with size 1
m= np.mat([[1,2,3],[3,5,6]])
m[1][1]             #注意不能像数组那样取值了
>>>IndexError: index 1 is out of bounds for axis 0 with size 1
m= np.mat([[1,2,3],[3,5,6]])
m[1,1]
>>>  5
np.array()
n=np.array([1,2,3])
n[1]
<<< 2
n[0,1]   #一维数组情况下不可以
>>>>IndexError: too many indices for array
n=np.array([[1,2,3],[3,5,6]])
>>>array([[1, 2, 3],
       [3, 5, 6]])
n[1][1]
>>>   5
n[0,1]     #二维数组可以
>>>  2
transpose()
m= np.mat([[1,2,3],[3,5,6]])
print(m)
print("-------------------"*2,'\n')
print(m.transpose())
>>>
[[1 2 3]
 [3 5 6]]
--------------------------------------

[[1 3]
 [2 5]
 [3 6]]


 5031
5031


 被折叠的 条评论
为什么被折叠?
被折叠的 条评论
为什么被折叠?
 到【灌水乐园】发言


