


使用python的matplotlib库绘制饼图,包括普通饼图、堆叠饼图、嵌套饼图,并一一封装成了方法,直接调用使用。
先安装matplotlib库,pip install matplotlib
代码如下:
from typing import Sequence
import matplotlib.pyplot as plt
import matplotlib
import numpy as np
matplotlib.rcParams['font.sans-serif'] = ['SimHei']
matplotlib.rcParams['axes.unicode_minus'] = False
matplotlib.use('TkAgg')
def pieChart(ax: plt.Axes, xs: Sequence, ys: Sequence):
"""绘制普通饼图"""
explode = [0] * (len(ys) - 1) + [0.2]
# 给了labels参数,就会直接显示再图形上,使用labeldistance控制位置
# 如果legend(),就不显示再图形上,显示再legend上
ax.pie(ys, autopct=lambda p: f'{p:.1f}%', labels=xs,
startangle=90, # 旋转角度
shadow=True, # 显示阴影
explode=explode, # 突出
)
ax.axis('equal') # 调整图形为标准圆形
ax.set_title('pie chart')
def stackPieChart(ax: plt.Axes, xs: Sequence, yss: Sequence[Sequence]):
"""绘制堆叠饼图"""
width = 0.3
radius = 0.7 + width * len(yss)
for index, i in enumerate(yss):
ax.pie(i, radius=radius, # 设置饼图的半径
autopct='%1.1f%%', # 设置百分比注释
pctdistance=1 - width / radius / 2, # 设置注释的位置
)
radius -= width
ax.add_artist(plt.Circle((0, 0), 0.70, fc='white')) # 设置饼图的中心为空缺
ax.axis('equal')
# ax.legend(xs, title='legend')
ax.set_title('stack pie chart')
def nestedPie(ax: plt.Axes, xs: Sequence, yss: Sequence[Sequence]):
"""绘制嵌套饼图"""
width = 0.4
radius = 1.2
yss = np.array(yss)
cmap = plt.colormaps["Wistia"]
# 这样生成的outer和inner颜色大致相对应
innerColors = cmap(np.linspace(0, 1, len(yss.flatten())))
outerColors = cmap(np.linspace(0, 1, len(yss)))
ax.pie(yss.flatten(), radius=radius, colors=innerColors,
labels=yss.flatten(), labeldistance=radius - width, # 在此配置labels
wedgeprops=dict(width=width, edgecolor='w'), )
ax.pie(yss.sum(axis=1), radius=radius + width, colors=outerColors, labels=xs,
wedgeprops=dict(width=width, edgecolor='w'))
ax.add_artist(plt.Circle((0, 0), radius - width, fc='white'))
ax.set_title('nested pie chart')
if __name__ == '__main__':
fig, axs = plt.subplots(2, 2)
plt.subplots_adjust(wspace=0.5, hspace=0.5) # 调整子图间距
axs = axs.flatten() # 将多维数组排列为一维
x = ['A', 'B', 'C', 'D', 'E']
y1 = [30, 23, 56, 27, 10]
y2 = [[23, 56, 27, 10, 30],
[30, 23, 56, 27, 10],
[27, 34, 17, 40, 10]]
pieChart(axs[0], x, y1)
stackPieChart(axs[1], x, y2)
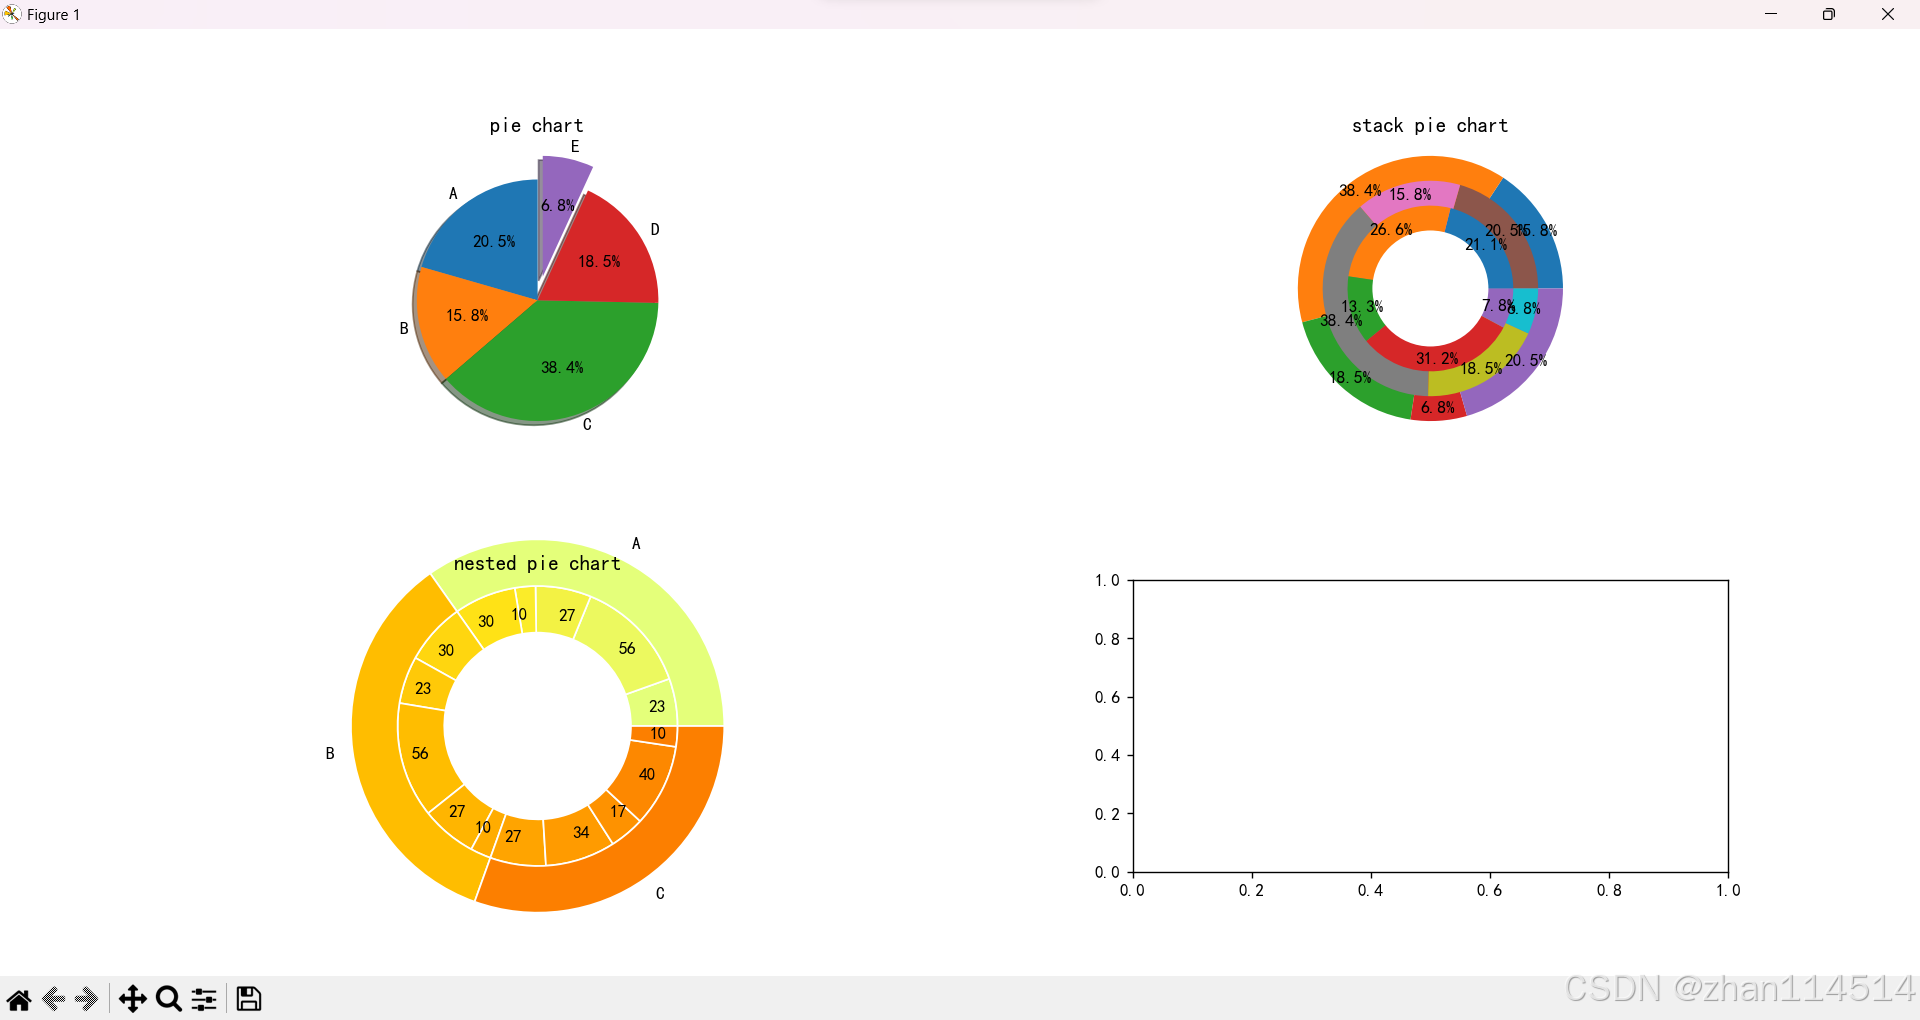
nestedPie(axs[2], x[:3], y2)
plt.show()效果图下:


 被折叠的 条评论
为什么被折叠?
被折叠的 条评论
为什么被折叠?
 到【灌水乐园】发言


