


1、贝塞尔曲线两种绘制方式
贝塞尔曲线按照绘制方式有两种:
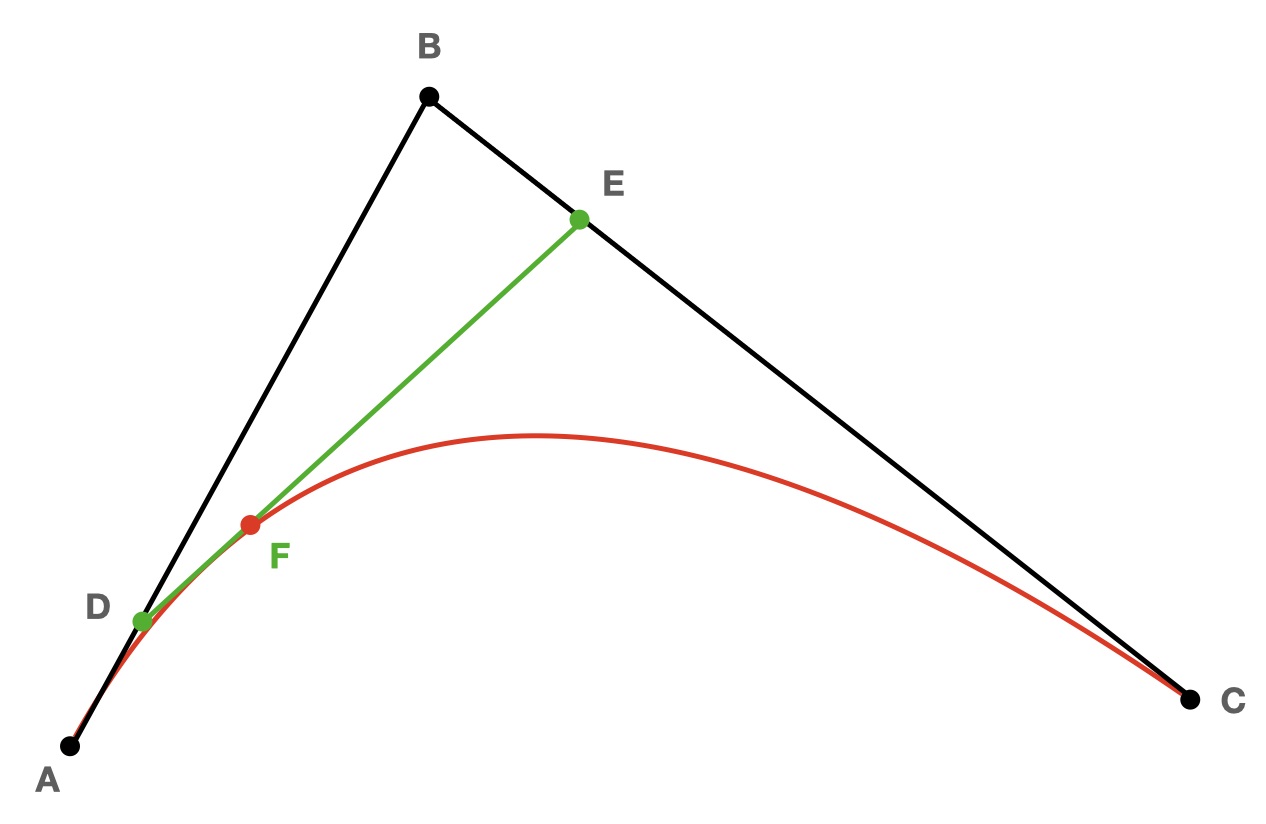
一种是直接绘制三个控制点A、B、C,
直线AB的方程式:f(t) = A·(1-t) + B·t, (0 <= t <=1)
直线BC的方程式:g(t) = B·(1-t) + C·t, (0 <= t <=1)
曲线AC的方程式:h(t) = f(t)·(1-t) + g(t)·t, (0 <= t <=1)
另一种是绘制两端+两个控制线(两个手柄)
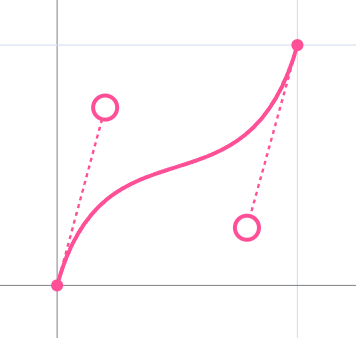
但是其实,两个手柄就是控制点,加上首尾就是4个控制点
2、python代码展示
需要安装第三方库matplotlib:
pip install matplotlib
完整代码如下:
import math
import matplotlib
import matplotlib.pyplot as plt
matplotlib.use('TkAgg')


class Bezier:
    def __init__(self, points: [[]]):
        self.points = points
        self.n = len(points) - 1

    def curve(self, t: float) -> [float]:
        points, n = self.points, self.n
        result = list(sum(math.comb(n, i) * (1 - t) ** (n - i) * t ** i * points[i][j] for i in range(n + 1)) for j in
                      range(len(points[0])))
        return result

    def appendPoint(self, point: [float]):
        self.points.append(point)
        self.n += 1

    def _rang(self, quantity: int = 100) -> [float]:
        return [i / quantity for i in range(quantity + 1)]

    def getCoordinate(self, quantity: int = 100) -> [[]]:
        return [self.curve(i) for i in self._rang(quantity)]

    def draw(self, ax: plt.Axes):
        if len(self.points[0]) != 2:
            raise ValueError('仅支持二维')
        xs, ys = list(zip(*self.getCoordinate()))
        ax.plot(xs, ys, '-', color='red', label='bezier curve')
        ax.plot(*list(zip(*ps)), '-.', color='green')
        ax.scatter(*list(zip(*ps)), color='blue', label='control points')
        ax.grid()
        ax.set_aspect("equal")
        ax.legend()


if __name__ == '__main__':
    fig, axs = plt.subplots()

    ps = [[0,0],[0,1],[1,0],[1,1]]
    bz = Bezier(ps)
    bz.draw(axs)
    plt.show()
运行结果:
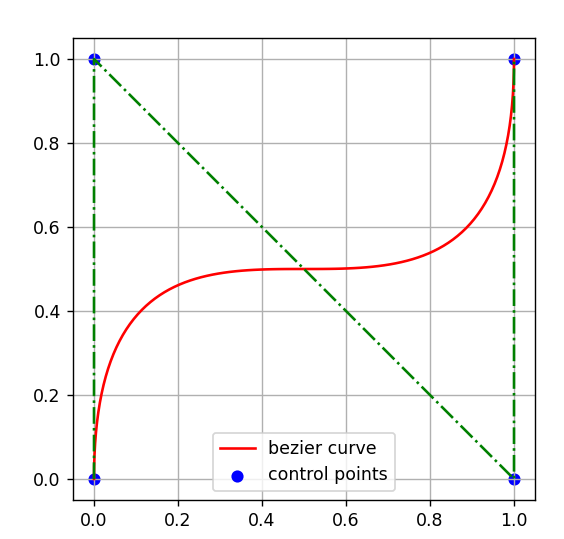
图像中:
蓝色点是控制点
绿色线为了表示点的顺序
红色是贝塞尔曲线
3、代码讲解
创建Bezier贝塞尔曲线class,构造器__init__(points)参数为点集,例如代码中点集为ps = [[0,0],[0,1],[1,0],[1,1]]
def curve(t)中,t为参数,范围为[0,1],用于计算贝塞尔曲线的方程式
内置def draw(),用于在matplotlib中展示结果,其中quantity为绘制曲线断点的数量,数越高,曲线越平滑
def appendPoint(point),末尾增加一个控制点,由此你可以扩展出更多类似方法
4、案例修改
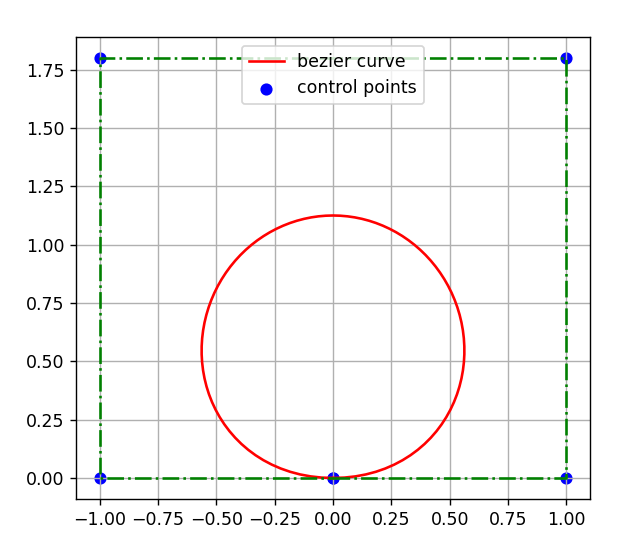
比如你想要用贝塞尔曲线绘制一个圆形(实际上不是的,只能是看着像圆)
将ps行改为ps = [[0, 0], [1, 0], [1, 1.8], [-1, 1.8], [-1, 0], [0, 0]]
就能得到以下结果:
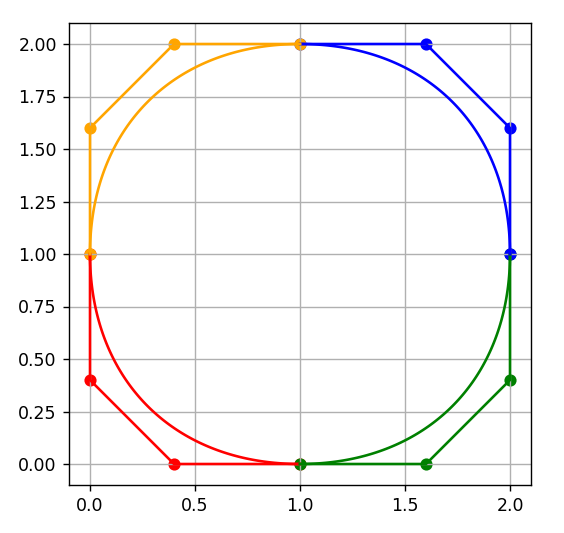
5、拓展多段三阶贝塞尔曲线
绘制一个圆形,这通常是一个PS使用者需要练习钢笔工具使用的,可以看到,这里就是四段三阶贝塞尔曲线(三阶贝塞尔曲线就是四个控制点)
代码如下:
import math
import matplotlib
import matplotlib.pyplot as plt
matplotlib.use('TkAgg')


class SubBezier:
    def __init__(self, pointss: [[[]]]):
        self.pointss = pointss
        self.ns = list(len(points) - 1 for points in self.pointss)
        self.colors = ['red', 'green', 'blue', 'orange', 'brown', 'yellow', 'purple', 'pink', ]

    def curve(self, t: float) -> [float]:
        points, ns = self.pointss, self.ns
        results = list(
            list(
                sum(math.comb(ns[k], i) * (1 - t) ** (ns[k] - i) * t ** i * points[k][i][j]
                    for i in range(ns[k] + 1)) for j in range(len(points[k][0]))
            )
            for k in range(len(ns)))
        return results

    def _rang(self, quantity: int = 100) -> [float]:
        return [i / quantity for i in range(quantity + 1)]

    def getCoordinate(self, quantity: int = 100) -> [[]]:
        print([self.curve(i) for i in self._rang(quantity)])
        return [self.curve(i) for i in self._rang(quantity)]

    def draw(self, ax: plt.Axes):
        for index, s in enumerate(list(zip(*self.getCoordinate()))):
            xs, ys = list(zip(*s))
            ax.plot(xs, ys, color=self.colors[index])
            ax.scatter(*list(zip(*ps[index])), color=self.colors[index])
            ax.plot(*list(zip(*ps[index])), color=self.colors[index])
        ax.grid()
        ax.set_aspect("equal")


if __name__ == '__main__':
    fig, axs = plt.subplots()

    ps = [
        [[0, 1], [0, 0.4], [0.4, 0], [1, 0]],
        [[1, 0], [1.6, 0], [2, 0.4], [2, 1]],
        [[2, 1], [2, 1.6], [1.6, 2], [1, 2]],
        [[1, 2], [0.4, 2], [0, 1.6], [0, 1]]
    ]
    bz = SubBezier(ps)
    bz.draw(axs)
    plt.show()
感谢您的观看,如果对你有收获,不妨点个赞


 1285
1285

 被折叠的 条评论
为什么被折叠?
被折叠的 条评论
为什么被折叠?
 到【灌水乐园】发言


