


1 检测python脚本的性能几种常见方式
- python time module
以前在写代码的时候看看每段代码的代码的耗时经常会用到 time module, 在代码开始前记录一下当前时间, 等要测试的代码执行完了再打印一下当前时间, 二者做差, 既可以打印出代码的执行时间.
import time

# 定义一个需要计时的函数
def test_function():
    return "-".join(str(n) for n in range(100))

# 记录开始执行的时间
start_time = time.time()
# 执行函数
test_function()
# 记录结束执行的时间
end_time = time.time()
# 打印执行时间
print(f"Function executed in: {end_time - start_time} seconds")
- python timeit module
timeit 中有个 timeit方法, 可以专门测试一段代码, 并制定执行n次, 然后取n次执行后的平均时间, 例如这个例子.
import timeit

# 定义一个需要计时的函数
def test_function():
    return "-".join(str(n) for n in range(100))

# 使用timeit模块计时
execution_time = timeit.timeit(test_function, number=1000)

# 打印执行时间
print(f"Function executed in: {execution_time} seconds")
- linux time 命令
直接上例子:
# 文件内容, 同上面的两个例子
[user]$ cat time_test.py

# 定义一个需要计时的函数
def test_function():
    return "-".join(str(n) for n in range(100))

test_function()

# 利用linux  time 模块看代码运行时间
[user]$ time python time_test.py

real    0m0.040s
user    0m0.030s
sys     0m0.010s
real:这是从程序开始运行到结束的实际经过的时间,也就是我们通常所说的“墙钟时间”或“挂钟时间”。这个时间包括了其他程序和系统的运行时间,因此它可能会受到系统负载等因素的影响。
user:这是程序在用户模式下运行的 CPU 时间。这是程序执行自己的代码所花费的时间,不包括系统调用和内核代码的执行时间。
sys:这是程序在内核模式下运行的 CPU 时间。当程序执行系统调用,或者触发中断等需要内核介入的操作时,CPU 会切换到内核模式。这个时间就是 CPU 在内核模式下运行的时间。
简单概述,real 时间表示程序从开始到结束的总时间,而 user 和 sys 时间则分别表示程序在用户模式和内核模式下运行的时间。
对这三种方式的一个简单总结:python time 模块需要自己写代码去测试待测试脚本每个部分的执行时间, timeit可以专门测试某段代码, 取多次执行的一个平均值, 相对客观些。 linux time 模块可以从整体上看脚本的运行时间。
2 cProfile 的使用
2.1 cProfile的使用和输出结果
除了第一部分介绍的检测脚本运行时间的方式, 这一部分看看python 自带的 用于剖析脚本性能的模块。
先看看文件内容, 这里为了让系统执行有点耗时, 我增加了循环的次数。
# 定义一个需要计时的函数
def test_function():
    return "-".join(str(n) for n in range(10000000))

test_function()
利用cProfile 模块分析代码中耗时的部分:
[user]$ python -m cProfile -s tottime time_test.py
         10000006 function calls in 2.763 seconds

   Ordered by: internal time

   ncalls  tottime  percall  cumtime  percall filename:lineno(function)
 10000001    1.656    0.000    1.656    0.000 time_test.py:5(<genexpr>)
        1    1.107    1.107    2.763    2.763 {method 'join' of 'str' objects}
        1    0.000    0.000    2.763    2.763 time_test.py:1(<module>)
        1    0.000    0.000    2.763    2.763 time_test.py:4(test_function)
        1    0.000    0.000    2.763    2.763 {built-in method builtins.exec}
        1    0.000    0.000    0.000    0.000 {method 'disable' of '_lsprof.Profiler' objects}
输出的结果中,
ncalls:函数被调用的次数。
tottime:函数总计运行的时间,不包括调用其他函数的时间。
percall:函数运行一次的平均时间,等于 tottime 除以 ncalls。
cumtime:函数总计运行的时间,包括调用其他函数的时间。
percall:函数运行一次的平均时间,等于 cumtime 除以 ncalls。
filename:lineno(function):函数所在的文件名,行号和函数名。
通过这些指标,我们可以理解代码的性能瓶颈在哪里,从而进行优化。上述例子中 “-”.join(str(n) for n in range(10000000)) 这行代码中的 str()函数调用了 10000000 +1 (1次调用来自 join 内部)。
2.2 图形化工具QCacheGrind (KCacheGrind)
cProfile 输出的文本结果, 对于复杂调用脚本来说, 可能分析比较困难, 本部分使用QCacheGrind 图形化工具来分析 cProfile的输出结果。
首先将cProfile的结果保存到文件 prof.out中
python -m cProfile -s tottime -o prof.out time_test.py
然后利用python module 将prof.out 转为能识别的文件格式 prof.calltree
pyprof2calltree -i prof.out -o prof.calltree
最后, 运行QCacheGrind , 并打开 prof.calltree.
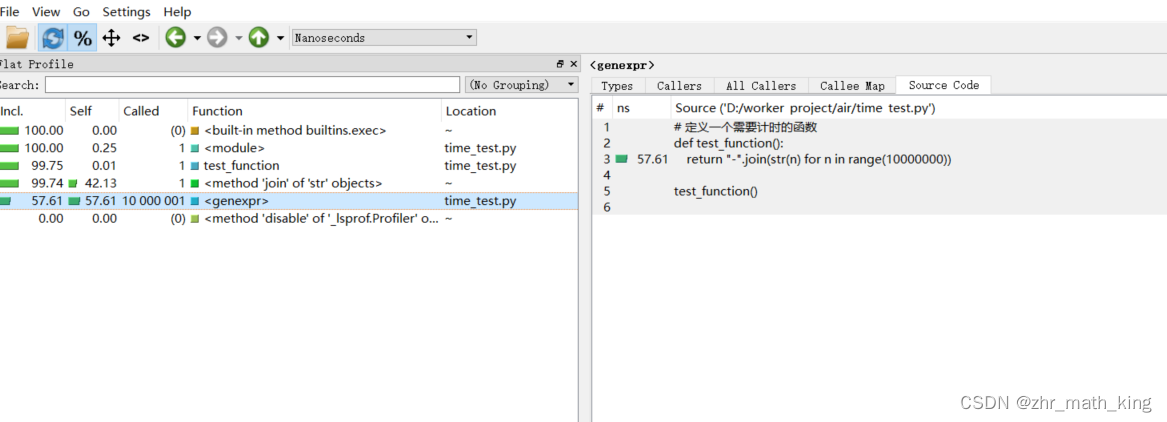
图形化工具运行截图中左边部分和prof.out的结果类似, Incl. 对应cumtime, Self 对应 tottime。 右侧可以看到调用 Map, source code, caller 等
一句话总结: 使用 cProfile 可以定位到哪一个函数需要被优化。
3 line_profiler 分析代码行
line_profiler 是一个 Python 工具,用于在代码的每一行上进行性能分析。以下是如何在命令行中使用 line_profiler:
- 首先,你需要安装
line_profiler。你可以使用pip来安装:
pip install line_profiler
- 然后,你需要在你想要分析的函数上添加一个装饰器
@profile。例如:
@profile
def test_function():
    return "-".join(str(n) for n in range(10000000))
-
保存你的 Python 文件,例如
test.py。 -
在命令行中,使用
kernprof命令来运行你的 Python 文件,并生成一个分析结果文件。例如:
kernprof -l -v time_test.py
在这个命令中,-l 参数告诉 kernprof 使用 line_profiler,-v 参数告诉 kernprof 在运行结束后立即显示分析结果。
注意:line_profiler 只能分析那些被 @profile 装饰的函数。如果你没有在任何函数上添加 @profile 装饰器,line_profiler 将不会输出任何结果。
上述命令的输出结果是
kernprof -l -v time_test.py

Wrote profile results to time_test.py.lprof
Timer unit: 1e-06 s

Total time: 5.92576 s
File: time_test.py
Function: test_function at line 2

Line #      Hits         Time  Per Hit   % Time  Line Contents
==============================================================
     2                                           @profile
     3                                           def test_function():
     4         1    5925756.0    6e+06    100.0      return "-".join(str(n) for n in range(10000000))
输出结果中每列的含义是:
Line #:这是源代码中的行号。
Hits:这是该行代码被执行的次数。
Time:这是在该行代码上花费的总时间,单位是 line_profiler 的时间单位(默认是微秒)。
Per Hit:这是每次执行该行代码所花费的平均时间,等于 Time 除以 Hits。
% Time:这是在该行代码上花费的时间占程序总运行时间的百分比。
Line Contents:这是源代码的实际内容。
4 memory_profiler
memory_profiler 是一个 Python 模块,用于监控 Python 程序的内存使用情况。以下是如何使用 memory_profiler 的基本步骤:
- 首先安装
memory_profiler。使用 pip 来安装:
pip install memory-profiler
- 在 Python 脚本中,使用
@profile装饰器来标记想要分析的函数。例如:
from memory_profiler import profile

@profile
def test_function():
    return "-".join(str(n) for n in range(10000000))
- 运行脚本。在命令行中使用
-m memory_profiler选项来运行脚本:
python -m memory_profiler time_test.py
这将在控制台输出内存使用情况的报告。
注意:memory_profiler 会让诊断程序的执行太慢了!!!
为了提高执行速度, 我们少测试点循环吧, 看下面的结果
$ python -m memory_profiler time_test.py
Filename: time_test.py

Line #    Mem usage    Increment  Occurrences   Line Contents
=============================================================
     4     22.8 MiB     22.8 MiB           1   @profile
     5                                         def test_function():
     6     30.3 MiB      1.5 MiB      200003       return "-".join(str(n) for n in range(100000))
Line #:这是源代码中的行号。
Mem usage:在执行到这一行代码时,Python 解释器的总内存使用量,单位是 MiB(Mebibyte,1 MiB = 1024 KiB)。
Increment:执行这一行代码后,内存使用量的增量,也是以 MiB 为单位。如果这一行代码导致内存使用量增加,这个值就是正数;如果内存使用量减少,这个值就是负数。
Occurrences:这一行代码在运行过程中被执行的次数。
Line Contents:这一行的源代码。
综上, 下次遇到python 脚本的性能问题, 可以用着几个小工具初步分析下。


 780
780

 被折叠的 条评论
为什么被折叠?
被折叠的 条评论
为什么被折叠?
 到【灌水乐园】发言


