


色图处理
函数命令:colormap,brighten
调用格式:colormap(map),brighten(s)
解释:colormap为将当前色图设置为系统预定义的map格式。
brighten为改变当前图形窗口色图的亮度
colormap可以用来做曲面不同的颜色对比,matlab提供的颜色对照表如下:
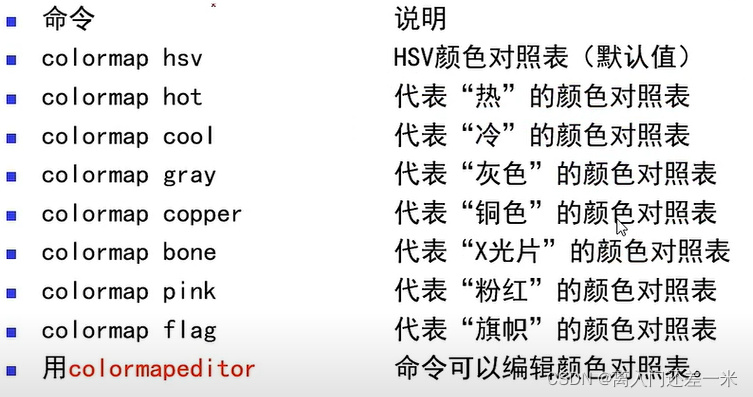
此外用colormapeditor命令可以编辑颜色对照表。
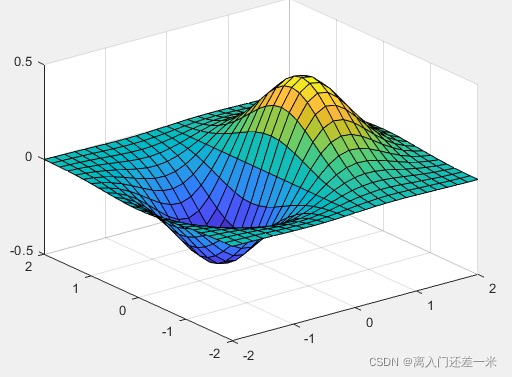
x=linspace(-2,2,25);
y=linspace(-2,2,25);
[X,Y]=meshgrid(x,y);
Z=X.*exp(-X.^2-Y.^2);
surf(X,Y,Z)
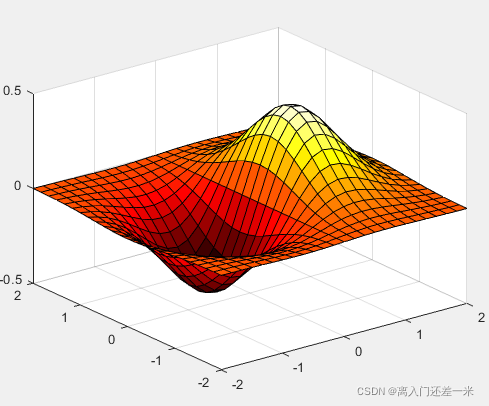
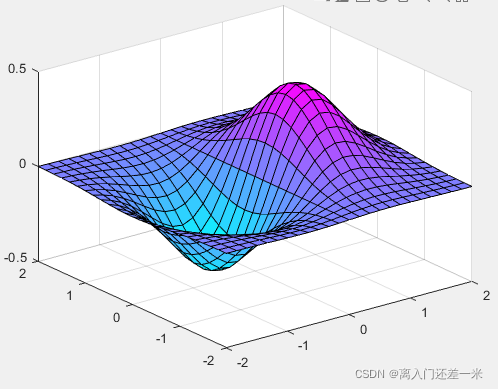
 x=linspace(-2,2,25);
y=linspace(-2,2,25);
[X,Y]=meshgrid(x,y);
Z=X.*exp(-X.^2-Y.^2);
surf(X,Y,Z);
colormap('hot');%热色
x=linspace(-2,2,25);
y=linspace(-2,2,25);
[X,Y]=meshgrid(x,y);
Z=X.*exp(-X.2-Y.2);
surf(X,Y,Z);
colormap(‘cool’);%冷色
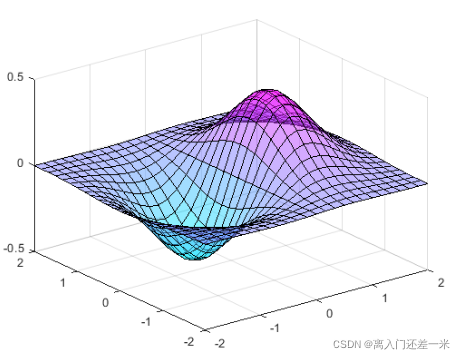
x=linspace(-2,2,25);
y=linspace(-2,2,25);
[X,Y]=meshgrid(x,y);
Z=X.*exp(-X.^2-Y.^2);
surf(X,Y,Z);
shading interp;%用interp方式着色
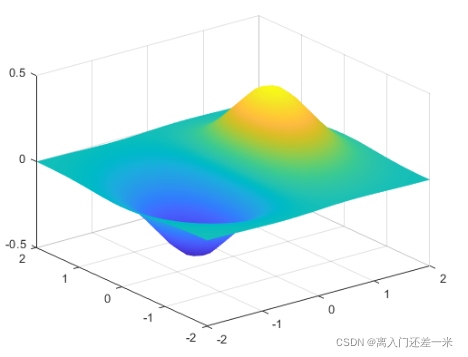
x=linspace(-2,2,25);
y=linspace(-2,2,25);
[X,Y]=meshgrid(x,y);
Z=X.*exp(-X.^2-Y.^2);
surf(X,Y,Z);
colormap('cool');
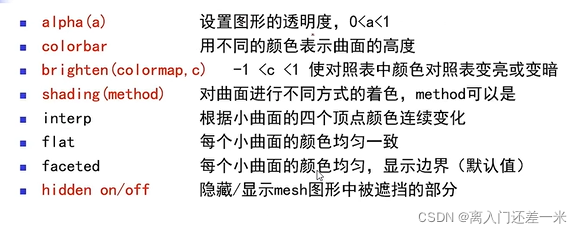
alpha(1/2)%改变透明度
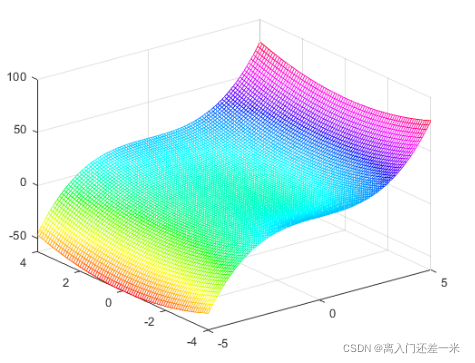
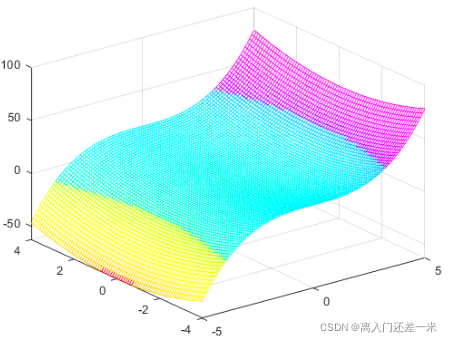
将下例的色图设置为红色-蓝色-深红色色图,同时将图形适当增亮。
x=(-5:0.1:5);
y=(-4:0.1:4);
[X,Y]=meshgrid(x,y);
Z=0.5*X.^3+Y.^2;
colormap(hsv);
brighten(0.30);
mesh(X,Y,Z)
x=(-5:0.1:5);
y=(-4:0.1:4);
[X,Y]=meshgrid(x,y);
Z=0.5*X.^3+Y.^2;
colormap(hsv);
brighten(0.90);
mesh(X,Y,Z)


 1667
1667

 被折叠的 条评论
为什么被折叠?
被折叠的 条评论
为什么被折叠?
 到【灌水乐园】发言


