


 本文介绍了Python的Pandas库,讲解了如何使用read_csv加载数据,通过head(n)查看数据前n行,利用Indexing操作数据,dtypes获取列数据类型,loc[]选择行和列,使用tolist()、describe()进行数据转换和统计分析,fillna()处理缺失值,unique()获取唯一值,apply()应用自定义函数,value_counts()计数统计,以及如何循环遍历DataFrame。
read_csv()
import pandas
food_info = pandas.read_csv("food_info.csv")
print(type(food_info)

output:
<class 'pandas.core.frame.DataFrame'>- read_csv()返回的是一个DataFrame对象。
- food_info.csv是一个food营养成分表格,每一行是一个food,每一列式一种营养成分,数值是含量。
head(n)
food_info = food_info.head(3)
dimensions = food_info.shape

output:
(3,36)

#此时创建了一个新的DataFrame对象- head(n)获取DataFrame的前n行,返回的是一个新的DataFrame.
Indexing
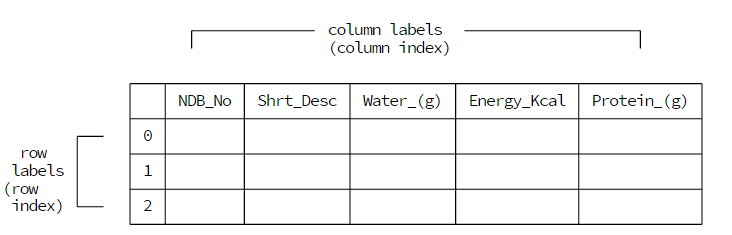
Pandas将文件的第一行当做列标签,将行号当做行标签。当对数据进行行索引的时候,返回的数据包含列标签和数值。当对数据进行列索引的时候,返回的数据包含行标签和数值。
dtypes
print(food_info.dtypes)
output:
NDB_No               int64
Shrt_Desc           object
Water_(g)          float64
...
FA_Mono_(g)        float64
FA_Poly_(g)        float64
Cholestrl_(mg)     float64
dtype: object
Pandas包含以下几种数据类型:
- object - for representing string values.
- int - for representing integer values.
- float - for representing float values.
- datetime - for representing time values.
- bool - for representing Boolean values.
DataFrame.dtypes返回每一列的数据类型
loc[ n ]
#选择第100行
hundredth_row = food_info.loc[99]
print(hundredth_row)

output:
NDB_No                                  1111
Shrt_Desc          MILK SHAKES THICK VANILLA
Water_(g)                              74.45
...
FA_Mono_(g)                            0.875
FA_Poly_(g)                            0.113
Cholestrl_(mg)                            12
Name: 99, dtype: object
loc[list]:取出list值对应的行,或者loc[[1,4,6]]。loc[5:8]:取出5 6 7 行。
选择多行的输出结果:
NDB_No Shrt_Desc Water_(g) Energ_Kcal Protein_(g) \ 3
1004 CHEESE BLUE 42.41 353 21.40 4
1005 CHEESE BRICK 41.11 371 23.24 5
1006 CHEESE BRIE 48.42 334 20.75注意:loc[ n ]选择行数据,返回的是列标签加数值
返回列数据——直接是food_info[”列标签“]
同理,取出多行food_info[list]或者food_info[[“标签1”,”标签2”]]
tolist()
#将列标签存储为列表形式
col_names = food_info.columns.tolist()
describe()
Returns
summary: NDFrame of summary statistics
Notes
The output DataFrame index depends on the requested dtypes:
For numeric dtypes, it will include: count, mean, std, min,max, and lower, 50, and upper percentiles.
For object dtypes (e.g. timestamps or strings), the index will
include the count, unique, most common, and frequency of the most common. Timestamps also include the first and last items.For mixed dtypes, the index will be the union of the corresponding
output types. Non-applicable entries will be filled with NaN.
#该数据是titanic上的乘客的信息
titanic = pandas.read_csv("titanic_train.csv")
print(titanic.describe())
结果显示:
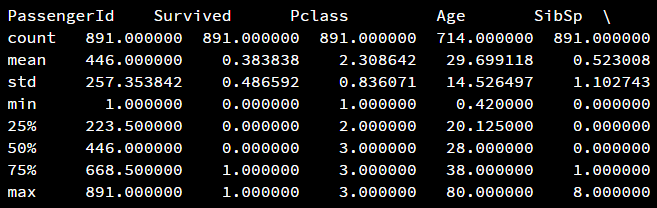
会发现,Age这一栏的count的值比其他的小,表Age有很多missing value,因此使用describe()可以帮助我们查看数据的详情,便于做出相应的处理。
fillna()
可以利用fillna()函数来填充缺省的数据,使用格式如下:
# 用中位数来填充缺省数据
titanic["Age"] = titanic["Age"].fillna(titanic["Age"].median())
unique()
titanic["Sex"].unique()- 上面返回的是该列取值范围,结果是[‘male’ ‘female’]
titanic.loc[titanic["Sex"] == "male", "Sex"] = 0
titanic.loc[titanic["Sex"] == "female", "Sex"] = 1- 将枚举类型的数据变为数值型,这样才可以进行机器学习,将性别替换为0,1.注意此处的用法,titanic[“Sex”] == “male”获取的是一个列向量,是male的行为True. 而titanic.loc[titanic[“Sex”] == “male”, “Sex”]得到的是Sex为male的那几行并且只包含”Sex”列数据,这扩展了前面的loc[],不只是获取某行,还可以同时确定获取某行的某列,具体细节自己去尝试。
apply()
This applies a function you pass in to each element in a dataframe or series. We can pass in a lambda function, which enables us to define a function inline.
Examples
——–
df.apply(numpy.sqrt) # returns DataFrame
df.apply(numpy.sum, axis=0) # equiv to df.sum(0)
df.apply(numpy.sum, axis=1) # equiv to df.sum(1)
- 也就是apply这个函数的参数是个函数,然后将df也就是一个DataFrame对象的每一个元素传入到apply这个参数的函数里去迭代。
value_counts
Parameters
———-
values : ndarray (1-d)
sort : boolean, default True
Sort by values
ascending : boolean, default False
Sort in ascending order
normalize: boolean, default False
If True then compute a relative histogram
bins : integer, optional
Rather than count values, group them into half-open bins,
convenience for pd.cut, only works with numeric data
dropna : boolean, default True
Don’t include counts of NaN
Returns
——-
value_counts : Series
循环遍历DataFrame
for index, row in data.iterrows(): index:数据的行号
row:包括标签和一行数据


 7万+
7万+

 被折叠的 条评论
为什么被折叠?
被折叠的 条评论
为什么被折叠?
 到【灌水乐园】发言


