


1. 闲话篇
机器学习(ML),自然语言处理(NLP),神马的,最近太火了。。。不知道再过几年,大家都玩儿ML,还会不会继续火下去。。。需要有人继续再添点柴火才行。本人仅仅是一个迷途小书童,知识有限,还望各位ML大神多多指点:)。
最近想系统地收拾一下ML的现有工具,发现比较好的应该是这个http://scikit-learn.org/stable/index.html。
对于初学和进阶阶段的ML研究者们是个不错的选择。不过美中不足的是少了Large-scale ML的一些,毕竟这是单机的。后面琢磨琢磨,写个ADMM(今年ICML剧多相关的论文)的吧,这个之前在MSRA的Learning Group做过一个Turtorial.
尤其是他的参考手册,更是没有太多废话,都能一针见血地讲明重点:http://scikit-learn.org/stable/user_guide.html
其实不要指望这个工具包能有啥新的东西,不过就是这些经典的东西,要是你真掌握了,也基本God Like!了。:),特别是你用ML创业的时候,可能真能用上一两个思路,也就是被训练出来的思想估计是大学能留下来的,剩下的都在狗肚子里。
我们来大致浏览一下这个系统的ML工具的功能,整体内容较多,我们逐步更新,想具体了解哪个部分的童鞋可以留言,我一下子还真很难都详细介绍(我会基本上保证一周更新一个小章节,逐步学习。首先弄懂模型原理,讲出来,然后使用对应数据实战一下,贴出代码,作图,最后利用测试结果适当比较一下模型之间的差异),所有的代码,我都会后续贴到CSDN或者Github上面。
---------------------------------------------------华丽丽的分割线---------------------------------------------------------
2. 配置篇
推荐学习配置:python 2.7, pycharm IDE (这个Python的IDE不错,推荐大家用下,如果用过Eclipse写Java,这个上手会很快), numpy, scipy。其他还有一些需要下载的包,大家可以边配置边有问题留言,建议在windows下面弄弄就行,我基本不用Linux。
有些小伙伴建议我也详细讲讲在windows下的配置。的确,这一系列的配置还真心没有那么简单,我特地找了一台windows7 Ultimiate SP1 x64 的裸机来重现一下整体配置过程。
首先是Python 2.7 (切记Python 3.x 和2.x的版本完全不是一路货,不存在3.x向下兼容的问题,所以,如果哪位小伙伴为了追求软件版本高而不小心安装了python 3.x,我只能说。。好吧。。你被坑了。最简单的理解,你可以认为这两个Python版本压根就不是一门相同的编程语言,就连print的语法都不同)
1. Python 2.7.x 在 x64 windows平台下的解释器。具体下载地址:https://www.python.org/download/releases/2.7.8/ 注意64位的是这个 Windows X86-64 MSI Installer (2.7.8)
测试这个Python是否在你的环境里配置好,你可以在命令行里直接输入python,如果报错,那么你需要手动配置一下环境,这个大家上网搜就可以解决(简单说,在环境变量PATH里把你的Python的安装文件夹路径写进去)。
2. 然后安装Pycharm,这个是我在Hulu实习的时候用到过的IDE,还是涛哥推荐的,还不错。因为有正版收费的问题,推荐大家下载它的(community)版 http://www.jetbrains.com/pycharm/download/。安装好后,它应该会让你选择刚才安装好的Python的解释器,这样你就可以做一些简单的python编程了,用过eclipse的人,这个上手非常快。
3. 接着就需要配置跟sklearn有关的一系列Python的扩展包了。这个美国加州一个学校的一个非官方网站张贴了所有windows直接安装的版本 http://www.lfd.uci.edu/~gohlke/pythonlibs/,特别实用,大家到里面去下载跟python 2.7 amd64有关的安装包。然后直接下载运行即可。需要下载的一系列扩展包的列表(按照依赖顺序):Numpy-MKL, SciPy, Scikit-learn。有了这些就可以学习Scikit-learn这个工具包了。
4. 此外,如果想像我一样,同时可以画图,那么就需要matplotlib,这个也有一个网站手册 http://matplotlib.org/contents.html,同样也需要一系列扩展包的支持。使用matplotlib 需要如下必备的库,numpy, dateutil, pytz, pyparsing, six。都能从刚才我推荐的下载网站上获取到。
上面的一系列都搞定了,大家可以使用我第一个线性回归的代码(加粗的代码)测试一下,直接输出图像,最后还能保存成为png格式的图片。
------------------------------华丽丽的分割线------------------------------------------
3. 数据篇
用工具之前先介绍几个我会用到的数据
这里大部分的数据都是从这个经典的机器学习网站提供的:
https://archive.ics.uci.edu/ml/
sklearn.datasets里面集成了这个网站里的部分数据(刚接触Python的童鞋,需要一点点Python的知识,和Java类似,使用现成工具模块的时候,需要import一下,我们这个基于Python的机器学习工具包的全名是sklearn,这里介绍数据,所以下一个目录是datasets)。具体的Python代码:
import sklearn.datasets
数据一:波士顿房价(适合做回归),以后直接用boston标记
这行代码就读进来了
boston = sklearn.datasets.load_boston()
查询具体数据说明,用这个代码:
print boston.DESCR
输出如下:
Data Set Characteristics:
:Number of Instances: 506
:Number of Attributes: 13 numeric/categorical predictive
:Median Value (attribute 14) is usually the target
:Attribute Information (in order):
- CRIM per capita crime rate by town
- ZN proportion of residential land zoned for lots over 25,000 sq.ft.
- INDUS proportion of non-retail business acres per town
- CHAS Charles River dummy variable (= 1 if tract bounds river; 0 otherwise)
- NOX nitric oxides concentration (parts per 10 million)
- RM average number of rooms per dwelling
- AGE proportion of owner-occupied units built prior to 1940
- DIS weighted distances to five Boston employment centres
- RAD index of accessibility to radial highways
- TAX full-value property-tax rate per $10,000
- PTRATIO pupil-teacher ratio by town
- B 1000(Bk - 0.63)^2 where Bk is the proportion of blacks by town
- LSTAT % lower status of the population
- MEDV Median value of owner-occupied homes in $1000's
一共506组数据,13维特征,
比如第一个维度的特征是犯罪率,第六个是每个房子平均多少房间等等。
boston.data 获取这506 * 13的特征数据
boston.target 获取对应的506 * 1的对应价格
数据二:牵牛花(适合做简单分类),标记为Iris
import sklearn.datasets
iris = sklearn.datasets.load_iris()
iris.data 获取特征
iris.target 获取对应的类别
Data Set Characteristics:
:Number of Instances: 150 (50 in each of three classes)
:Number of Attributes: 4 numeric, predictive attributes and the class
:Attribute Information:
- sepal length in cm
- sepal width in cm
- petal length in cm
- petal width in cm
- class:
- Iris-Setosa
- Iris-Versicolour
- Iris-Virginica
这个数据基本是个ML的入门选手都知道,一共三类牵牛花,获取特征和对应的类别标签也是同上
一共150样本,3类,特征维度为4
数据三: 糖尿病(回归问题),diabetes
这个数据包很奇怪,没有描述。我也到原本的UCI的网站上查了一下,也是没有太好的描述。
import sklearn.datasets
diabetes = sklearn.datasets.load_diabetes()
print diabetes.keys()
这样的输出只有data, targets。
我也观察了一下数据,感觉是经过额外的归一化处理的,原始的数据样貌已经看不出来了。。
下面这个图是我从网站上Copy下来的有限的描述,样本量为442,特征维度为10,每个特征元素的值都是连续的实数,在正负0.2之间。。目标这个整数值有可能是血糖。
| Samples total | 442 |
| Dimensionality | 10 |
| Features | real, -.2 < x < .2 |
| Targets | integer 25 - 346 |
数据四:手写数字识别(多类分类,10个类别,从0-9)digits
import sklearn.datasets
digits = sklearn.datasets.load_digits()
总体样本量:1797,每个类别大约180个样本,每个手写数字是一个8*8的图片,每个像素是0-16的整数值。
综上,大家可以加载相应的数据来玩,这几个数据算是比较有代表性的。后面会介绍如何利用SKLEARN工具下载更大规模的数据,比如MINIST的大规模的手写数字识别库等等。
总之,如果你想获取特征,就在*.data里,对应的类别或者回归值在*.target里面
光说不练不行,我对每个介绍的方法都会选用上面的Dataset实际测试一下,并且会酌情给出结果和图像。
------------------------------华丽丽的分割线------------------------------------------
4.实战篇
这个监督学习最常用,分类啊,预测回归(预测个股票啥的,虽然在我大天朝不太适合)啊。
1.1. Generalized Linear Models
最通用的线性模型

把你的特征x和对应的权重w相加,最后争取接近你的目标y,机器学的就是w。
这个模型应用最广,其实就是大家会权衡各种各样的因素,最后给一个总评。
1.1.1. Ordinary Least Squares 最小二乘约束
目标函数是这个
 。
。要总体的平方和最小。
具体代码大家import sklearn.linear_model,然后sklearn.linear_model.LinearRegression()就是这个模块了。做个简单的什么房价估计还行(别说预测,那个不准,只能说估计一下租房的价格,随便在搜房网上弄点儿数据,他那里有现成的特征,什么地理位置啊,面积啊,朝向啊等等,最后你回归一个大致房价玩玩)。
我们就使用波士顿的房价来预测一下(后面的所有python代码注意缩进!我是没工夫一行一行调整了。。。多包涵):
'''
Author: Miao Fan
Affiliation: Department of Computer Science and Technology, Tsinghua University, P.R.China.
Email: fanmiao.cslt.thu@gmail.com
'''
import sklearn.datasets
import sklearn.linear_model
import numpy.random
import numpy.linalg
import matplotlib.pyplot
if __name__ == "__main__":
# Load boston dataset
boston = sklearn.datasets.load_boston()
# Split the dataset with sampleRatio
sampleRatio = 0.5
n_samples = len(boston.target)
sampleBoundary = int(n_samples * sampleRatio)
# Shuffle the whole data
shuffleIdx = range(n_samples)
numpy.random.shuffle(shuffleIdx)
# Make the training data
train_features = boston.data[shuffleIdx[:sampleBoundary]]
train_targets = boston.target[shuffleIdx [:sampleBoundary]]
# Make the testing data
test_features = boston.data[shuffleIdx[sampleBoundary:]]
test_targets = boston.target[shuffleIdx[sampleBoundary:]]
# Train
linearRegression = sklearn.linear_model.LinearRegression()
linearRegression.fit(train_features, train_targets)
# Predict
predict_targets = linearRegression.predict(test_features)
# Evaluation
n_test_samples = len(test_targets)
X = range(n_test_samples)
error = numpy.linalg.norm(predict_targets - test_targets, ord = 1) / n_test_samples
print "Ordinary Least Squares (Boston) Error: %.2f" %(error)
# Draw
matplotlib.pyplot.plot(X, predict_targets, 'r--', label = 'Predict Price')
matplotlib.pyplot.plot(X, test_targets, 'g:', label='True Price')
legend = matplotlib.pyplot.legend()
matplotlib.pyplot.title("Ordinary Least Squares (Boston)")
matplotlib.pyplot.ylabel("Price")
matplotlib.pyplot.savefig("Ordinary Least Squares (Boston).png", format='png')
matplotlib.pyplot.show()
结果:
Ordinary Least Squares (Boston) Error: 3.35。基本上,平均每笔预测,都会距离真实的价格差3350美金,这个数值的单位是1000 U.S.D. (见数据描述)
下面这个图就是预测和实际价格的对比图线,这里是随机采样了50%作为训练,50%做预测,效果还行,看来这个线性模型还可以接受。

1.1.2. Ridge Regression
这个中文一般叫岭回归,就是在上面的目标函数上加个正则项,岭回归用二范数(L2 norm)。

这个范数的目的在于对整体学习到的权重都控制得比较均衡,因为我们的数据不能保证非常正常,有的时候,接近线性相关的那些噪声样本会加剧权重系数的非均衡学习,最后就是这个样子

一旦某个特征噪音比较大,刚好那个权重也不小,那回归结果就惨了。
好,我们再用波士顿的房价试试岭回归。
'''
Author: Miao Fan
Affiliation: Department of Computer Science and Technology, Tsinghua University, P.R.China.
Email: fanmiao.cslt.thu@gmail.com
'''
import sklearn.datasets
import sklearn.linear_model
import numpy.random
import numpy.linalg
import matplotlib.pyplot
if __name__ == "__main__":
# Load boston dataset
boston = sklearn.datasets.load_boston()
# Split the dataset with sampleRatio
sampleRatio = 0.5
n_samples = len(boston.target)
sampleBoundary = int(n_samples * sampleRatio)
# Shuffle the whole data
shuffleIdx = range(n_samples)
numpy.random.shuffle(shuffleIdx)
# Make the training data
train_features = boston.data[shuffleIdx[:sampleBoundary]]
train_targets = boston.target[shuffleIdx [:sampleBoundary]]
# Make the testing data
test_features = boston.data[shuffleIdx[sampleBoundary:]]
test_targets = boston.target[shuffleIdx[sampleBoundary:]]
# Train with Cross Validation
ridgeRegression = sklearn.linear_model.RidgeCV(alphas=[0.01, 0.05, 0.1, 0.5, 1.0, 10.0])
这个地方使用RidgeCV 直接交叉验证出我需要试验的几个惩罚因子,它会帮我选择这些里面在集内测试表现最优的一个参数。后面的输出选择了0.1。
ridgeRegression.fit(train_features, train_targets)
print "Alpha = ", ridgeRegression.alpha_
# Predict
predict_targets = ridgeRegression.predict(test_features)
# Evaluation
n_test_samples = len(test_targets)
X = range(n_test_samples)
error = numpy.linalg.norm(predict_targets - test_targets, ord = 1) / n_test_samples
print "Ridge Regression (Boston) Error: %.2f" %(error)
# Draw
matplotlib.pyplot.plot(X, predict_targets, 'r--', label = 'Predict Price')
matplotlib.pyplot.plot(X, test_targets, 'g:', label='True Price')
legend = matplotlib.pyplot.legend()
matplotlib.pyplot.title("Ridge Regression (Boston)")
matplotlib.pyplot.ylabel("Price (1000 U.S.D)")
matplotlib.pyplot.savefig("Ridge Regression (Boston).png", format='png')
matplotlib.pyplot.show()
输出:
Alpha = 0.1
Ridge Regression (Boston) Error: 3.21
基本上,这样的结果,误差在3210美金左右,比之前的最一般的线性模型好一点。而且,这种情况下,基本上预测出来的图线的方差比较小,振幅略小,因为有Ridge的惩罚项的约束,保证每个特征的变化不会对整体预测有过大的影响
1.1.3. Lasso

老是听MSRA的师兄说这个,貌似还挺火的一个研究,这里面就是把二范数(L2)换成一范数(L1)。
绝对值的这个约束,更想让学习到的权重稀疏一些,压缩感知啥的跟这个有关。

这个估计不会有太大的性能提升,对于Boston数据,因为本来特征就不稀疏,后面可以试试newsgroup20。那个够稀疏。
'''
Author: Miao Fan
Affiliation: Department of Computer Science and Technology, Tsinghua University, P.R.China.
Email: fanmiao.cslt.thu@gmail.com
'''
import sklearn.datasets
import sklearn.linear_model
import numpy.random
import numpy.linalg
import matplotlib.pyplot
if __name__ == "__main__":
# Load boston dataset
boston = sklearn.datasets.load_boston()
# Split the dataset with sampleRatio
sampleRatio = 0.5
n_samples = len(boston.target)
sampleBoundary = int(n_samples * sampleRatio)
# Shuffle the whole data
shuffleIdx = range(n_samples)
numpy.random.shuffle(shuffleIdx)
# Make the training data
train_features = boston.data[shuffleIdx[:sampleBoundary]]
train_targets = boston.target[shuffleIdx [:sampleBoundary]]
# Make the testing data
test_features = boston.data[shuffleIdx[sampleBoundary:]]
test_targets = boston.target[shuffleIdx[sampleBoundary:]]
# Train
lasso = sklearn.linear_model.LassoCV(alphas=[0.01, 0.05, 0.1, 0.5, 1.0, 10.0])
lasso.fit(train_features, train_targets)
print "Alpha = ", lasso.alpha_
# Predict
predict_targets = lasso.predict(test_features)
# Evaluation
n_test_samples = len(test_targets)
X = range(n_test_samples)
error = numpy.linalg.norm(predict_targets - test_targets, ord = 1) / n_test_samples
print "Lasso (Boston) Error: %.2f" %(error)
# Draw
matplotlib.pyplot.plot(X, predict_targets, 'r--', label = 'Predict Price')
matplotlib.pyplot.plot(X, test_targets, 'g:', label='True Price')
legend = matplotlib.pyplot.legend()
matplotlib.pyplot.title("Lasso (Boston)")
matplotlib.pyplot.ylabel("Price (1000 U.S.D)")
matplotlib.pyplot.savefig("Lasso (Boston).png", format='png')
matplotlib.pyplot.show()
输出:
Alpha = 0.01
Lasso (Boston) Error: 3.39
这个结果的振幅还是比较大的。特别是对于低价位的振幅。

1.1.4. Elastic Net
这个不知道中文怎么说合适,其实就是兼顾了上面两个正则项(L1和L2两个先验(Prior)),既保证能够训练出一组比较稀疏的模型(Lasso的贡献),同时还能兼具岭回归L2的好处。这个我没试过,不知道啥样的数据这么做最合适,回头我试几个数据集,比较一下普通的线性回归和这个模型的性能。

很自然地,要用一个额外的参数来平衡这两个先验约束,一个是惩罚因子alpha,这个之前也有,另一个就是 。这些参数都可以用交叉验证CV来搞定(每个线性模型都有相应的CV方法,比如ElasticNetCV就是用来干这个的,其实这种CV方法就是模型选择的范畴了,因为每个不同的额外参数,不是你要学习的W。比如惩罚因子,平衡因子等等,这些构成了不同的数学模型,CV的目标就是来选择合适的模型,然后再去学习W)。这把来个大锅烩,两种范数都用上了:
'''
Author: Miao Fan
Affiliation: Department of Computer Science and Technology, Tsinghua University, P.R.China.
Email: fanmiao.cslt.thu@gmail.com
'''
import sklearn.datasets
import sklearn.linear_model
import numpy.random
import numpy.linalg
import matplotlib.pyplot
if __name__ == "__main__":
# Load boston dataset
boston = sklearn.datasets.load_boston()
# Split the dataset with sampleRatio
sampleRatio = 0.5
n_samples = len(boston.target)
sampleBoundary = int(n_samples * sampleRatio)
# Shuffle the whole data
shuffleIdx = range(n_samples)
numpy.random.shuffle(shuffleIdx)
# Make the training data
train_features = boston.data[shuffleIdx[:sampleBoundary]]
train_targets = boston.target[shuffleIdx [:sampleBoundary]]
# Make the testing data
test_features = boston.data[shuffleIdx[sampleBoundary:]]
test_targets = boston.target[shuffleIdx[sampleBoundary:]]
# Train
elasticNet = sklearn.linear_model.ElasticNetCV(alphas=[0.01, 0.05, 0.1, 0.5, 1.0, 10.0], l1_ratio=[0.1,0.3,0.5,0.7,0.9])
elasticNet.fit(train_features, train_targets)
print "Alpha = ", elasticNet.alpha_
print "L1 Ratio = ", elasticNet.l1_ratio_
# Predict
predict_targets = elasticNet.predict(test_features)
# Evaluation
n_test_samples = len(test_targets)
X = range(n_test_samples)
error = numpy.linalg.norm(predict_targets - test_targets, ord = 1) / n_test_samples
print "Elastic Net (Boston) Error: %.2f" %(error)
# Draw
matplotlib.pyplot.plot(X, predict_targets, 'r--', label = 'Predict Price')
matplotlib.pyplot.plot(X, test_targets, 'g:', label='True Price')
legend = matplotlib.pyplot.legend()
matplotlib.pyplot.title("Elastic Net (Boston)")
matplotlib.pyplot.ylabel("Price (1000 U.S.D)")
matplotlib.pyplot.savefig("Elastic Net (Boston).png", format='png')
matplotlib.pyplot.show()
输出:
Alpha = 0.01
L1 Ratio = 0.9
Elastic Net (Boston) Error: 3.14
貌似还是混合所有制比较牛逼!知道这年头审论文最怕遇到题目里面有啥么?Hybird...,这尼玛性能不提升都对不起这个单词。。。

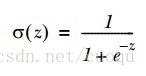
1.1.10. Logistic regression
这里补充一个比较实用的逻辑斯蒂回归,虽然名字叫这个,但是一般用在分类上。
采用这个函数来表达具体样本的特征加权组合能够分到哪个类别上(注:下面的图片来自博客http://blog.csdn.net/marvin521/article/details/9263483)

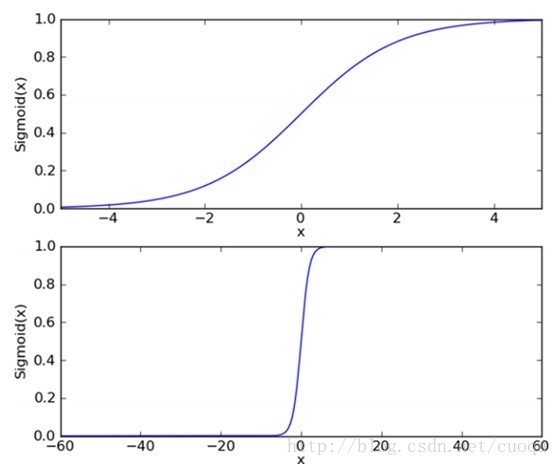
下面的这个sigmod函数对于z值特别敏感,但是他的优点在于他是连续可导的,这个非常重要,便于我们用梯度法计算W。
事实证明,Logistic Regression做分类非常好用也很易用,据说Goolge对点击率CTR的预测也会用到这个模型,这个我没有考证过,只是听说,不过下面的代码对Iris的分类结果倒是也能说明这个做分类也是挺好用的(这里强调,我们经常看到Logistic Regression用来做二分类,事实上它可以拓展到对多类分类上,我这里不过多介绍,大家可以查Softmax Regression做参考)。
我们使用Iris的数据来测试一下:
大致回顾一下Iris(牵牛花(数据篇有详细介绍))的数据特点:150个样本,3类,每类基本50条数据,每个数据条目4中特征,都是连续数值类型。我们的目标就是把随机抽取的50%(切记要随机打乱数据,这个数据原始的顺序不是打乱的,前50条都是一个类别,别弄错了。)的数据做个类别0,1,2的预测。
'''
Author: Miao Fan
Affiliation: Department of Computer Science and Technology, Tsinghua University, P.R.China.
Email: fanmiao.cslt.thu@gmail.com
'''
import sklearn.datasets
import sklearn.linear_model
import numpy.random
import matplotlib.pyplot
if __name__ == "__main__":
# Load iris dataset
iris = sklearn.datasets.load_iris()
# Split the dataset with sampleRatio
sampleRatio = 0.5
n_samples = len(iris.target)
sampleBoundary = int(n_samples * sampleRatio)
# Shuffle the whole data
shuffleIdx = range(n_samples)
numpy.random.shuffle(shuffleIdx)
# Make the training data
train_features = iris.data[shuffleIdx[:sampleBoundary]]
train_targets = iris.target[shuffleIdx [:sampleBoundary]]
# Make the testing data
test_features = iris.data[shuffleIdx[sampleBoundary:]]
test_targets = iris.target[shuffleIdx[sampleBoundary:]]
# Train
logisticRegression = sklearn.linear_model.LogisticRegression()
logisticRegression.fit(train_features, train_targets)
# Predict
predict_targets = logisticRegression.predict(test_features)
# Evaluation
n_test_samples = len(test_targets)
X = range(n_test_samples)
correctNum = 0
for i in X:
if predict_targets[i] == test_targets[i]:
correctNum += 1
accuracy = correctNum * 1.0 / n_test_samples
print "Logistic Regression (Iris) Accuracy: %.2f" %(accuracy)
# Draw
matplotlib.pyplot.subplot(2, 1, 1)
matplotlib.pyplot.title("Logistic Regression (Iris)")
matplotlib.pyplot.plot(X, predict_targets, 'ro-', label = 'Predict Labels')
matplotlib.pyplot.ylabel("Predict Class")
legend = matplotlib.pyplot.legend()
matplotlib.pyplot.subplot(2, 1, 2)
matplotlib.pyplot.plot(X, test_targets, 'g+-', label='True Labels')
legend = matplotlib.pyplot.legend()
matplotlib.pyplot.ylabel("True Class")
matplotlib.pyplot.savefig("Logistic Regression (Iris).png", format='png')
matplotlib.pyplot.show()
输出:
Logistic Regression (Iris) Accuracy: 0.95
使用50%作训练,50%做测试,分类精度可以达到95%。
下面这个图算是一个直观的辅助,因为分类精度比较高,所以预测类别和真实类别对应的走势几乎相同:


 754
754


 被折叠的 条评论
为什么被折叠?
被折叠的 条评论
为什么被折叠?
 到【灌水乐园】发言


