一、前言
在《机器学习论文复现实战---linear regression》中通过Pearson 相关性分析,去除了2个高相关性特征 "PN" 和 "AN" ,数据维度变为890*25。(数据集地址)
这里我们不做前期处理,直接就将数据放入 Random Forest Regressor 模型中进行训练了。
二、模型训练过程
2.1 导入Python库
'''====================导入Python库===================='''
import pandas as pd               #python科学计算库
import numpy as np                #Python的一个开源数据分析处理库。
import matplotlib.pyplot as plt   #常用Python画图工具
from sklearn.ensemble import RandomForestRegressor  # 导入 RandomForestRegressor 模型
from sklearn.model_selection import train_test_split # 数据划分模块
from sklearn.preprocessing import StandardScaler   # 标准化模块
from sklearn.metrics import mean_squared_error, r2_score   #误差函数MSE,误差函数R^2,
from sklearn.model_selection import GridSearchCV     #超参数网格搜索
2.2 导入数据
'''========================导入数据========================'''
data = pd.read_excel('D:/复现/trainset_loop6.xlsx')  #读取xlsx格式数据
# date = pd.read_csv('D:/复现/trainset_loop6.csv')   #读取csv格式数据
print(data.isnull().sum())   #检查数据中是否存在缺失值
print(data.shape)   #检查维度
print(data.columns) #数据的标签
data = data.drop(["PN","AN"], axis = 1) #axis = 1表示对列进行处理,0表示对行
Y, X = data['Eads'] , data.drop(['Eads'] , axis = 1) #对Y、X分别赋值
2.3 标准化
'''=========================标准化========================'''
#利用StandardScaler函数对X进行标准化处理
scaler = StandardScaler()
X = scaler.fit_transform(X)
'''====================划分训练集与测试集==================='''
X_train,X_test,y_train,y_test = train_test_split(X , Y , test_size=0.2 , random_state=42)
2.4 模型训练
# 定义超参数网格。
n_estimators = [300,500,700,900]
max_depth = [4,5,6,7,8,9]
# min_samples_leaf = [1,3,5,7,9,11]  #有点费时间就没加这个超参数,想加的可以加,(不加可能会有点过拟合)。
# 网格搜索,cv = 5表示进行5折交叉验证
grid_search = GridSearchCV(estimator = model,cv = 5, param_grid={'max_depth': max_depth,"n_estimators":n_estimators}, scoring='neg_mean_squared_error')
grid_search.fit(X_train, y_train)
# 最佳模型
best_model = grid_search.best_estimator_
# 最佳超参数
best_max_depth = grid_search.best_params_['max_depth']
# best_min_samples_leaf = grid_search.best_params_['min_samples_leaf']
best_n_estimators = grid_search.best_params_['n_estimators']
print(f'Best max_depth:{best_max_depth:.3f}',"\n",f'Best n_estimators:{best_n_estimators:.3f}')
通过 GridSearchCV 搜索最优的 Best alpha:(有点耗时就没有在搜索了)
Best max_depth:9.000
Best n_estimators:900.000
2.5 模型预测与评估
'''=======================模型预测========================'''
# best_model模型预测
y_pred_train = best_model.predict(X_train)
y_pred_test = best_model.predict(X_test)
#评估
mse_train=mean_squared_error(y_train,y_pred_train)  #均方误差越小模型越好
mse_test=mean_squared_error(y_test,y_pred_test)     #R2 表示模型对因变量的解释能力,取值范围从 0 ~ 1,越接近 1 表示模型对数据的拟合程度越好。
r2_train=r2_score(y_train,y_pred_train)
r2_test=r2_score(y_test,y_pred_test)
print(f'MSE(Train):{mse_train:.3f}')  #保留2位小数
print(f'MSE(Test):{mse_test:.3f}')
print(f'R^2(Train):{r2_train:.3f}')
print(f'R^2(Test):{r2_test:.3f}') MSE与结果:
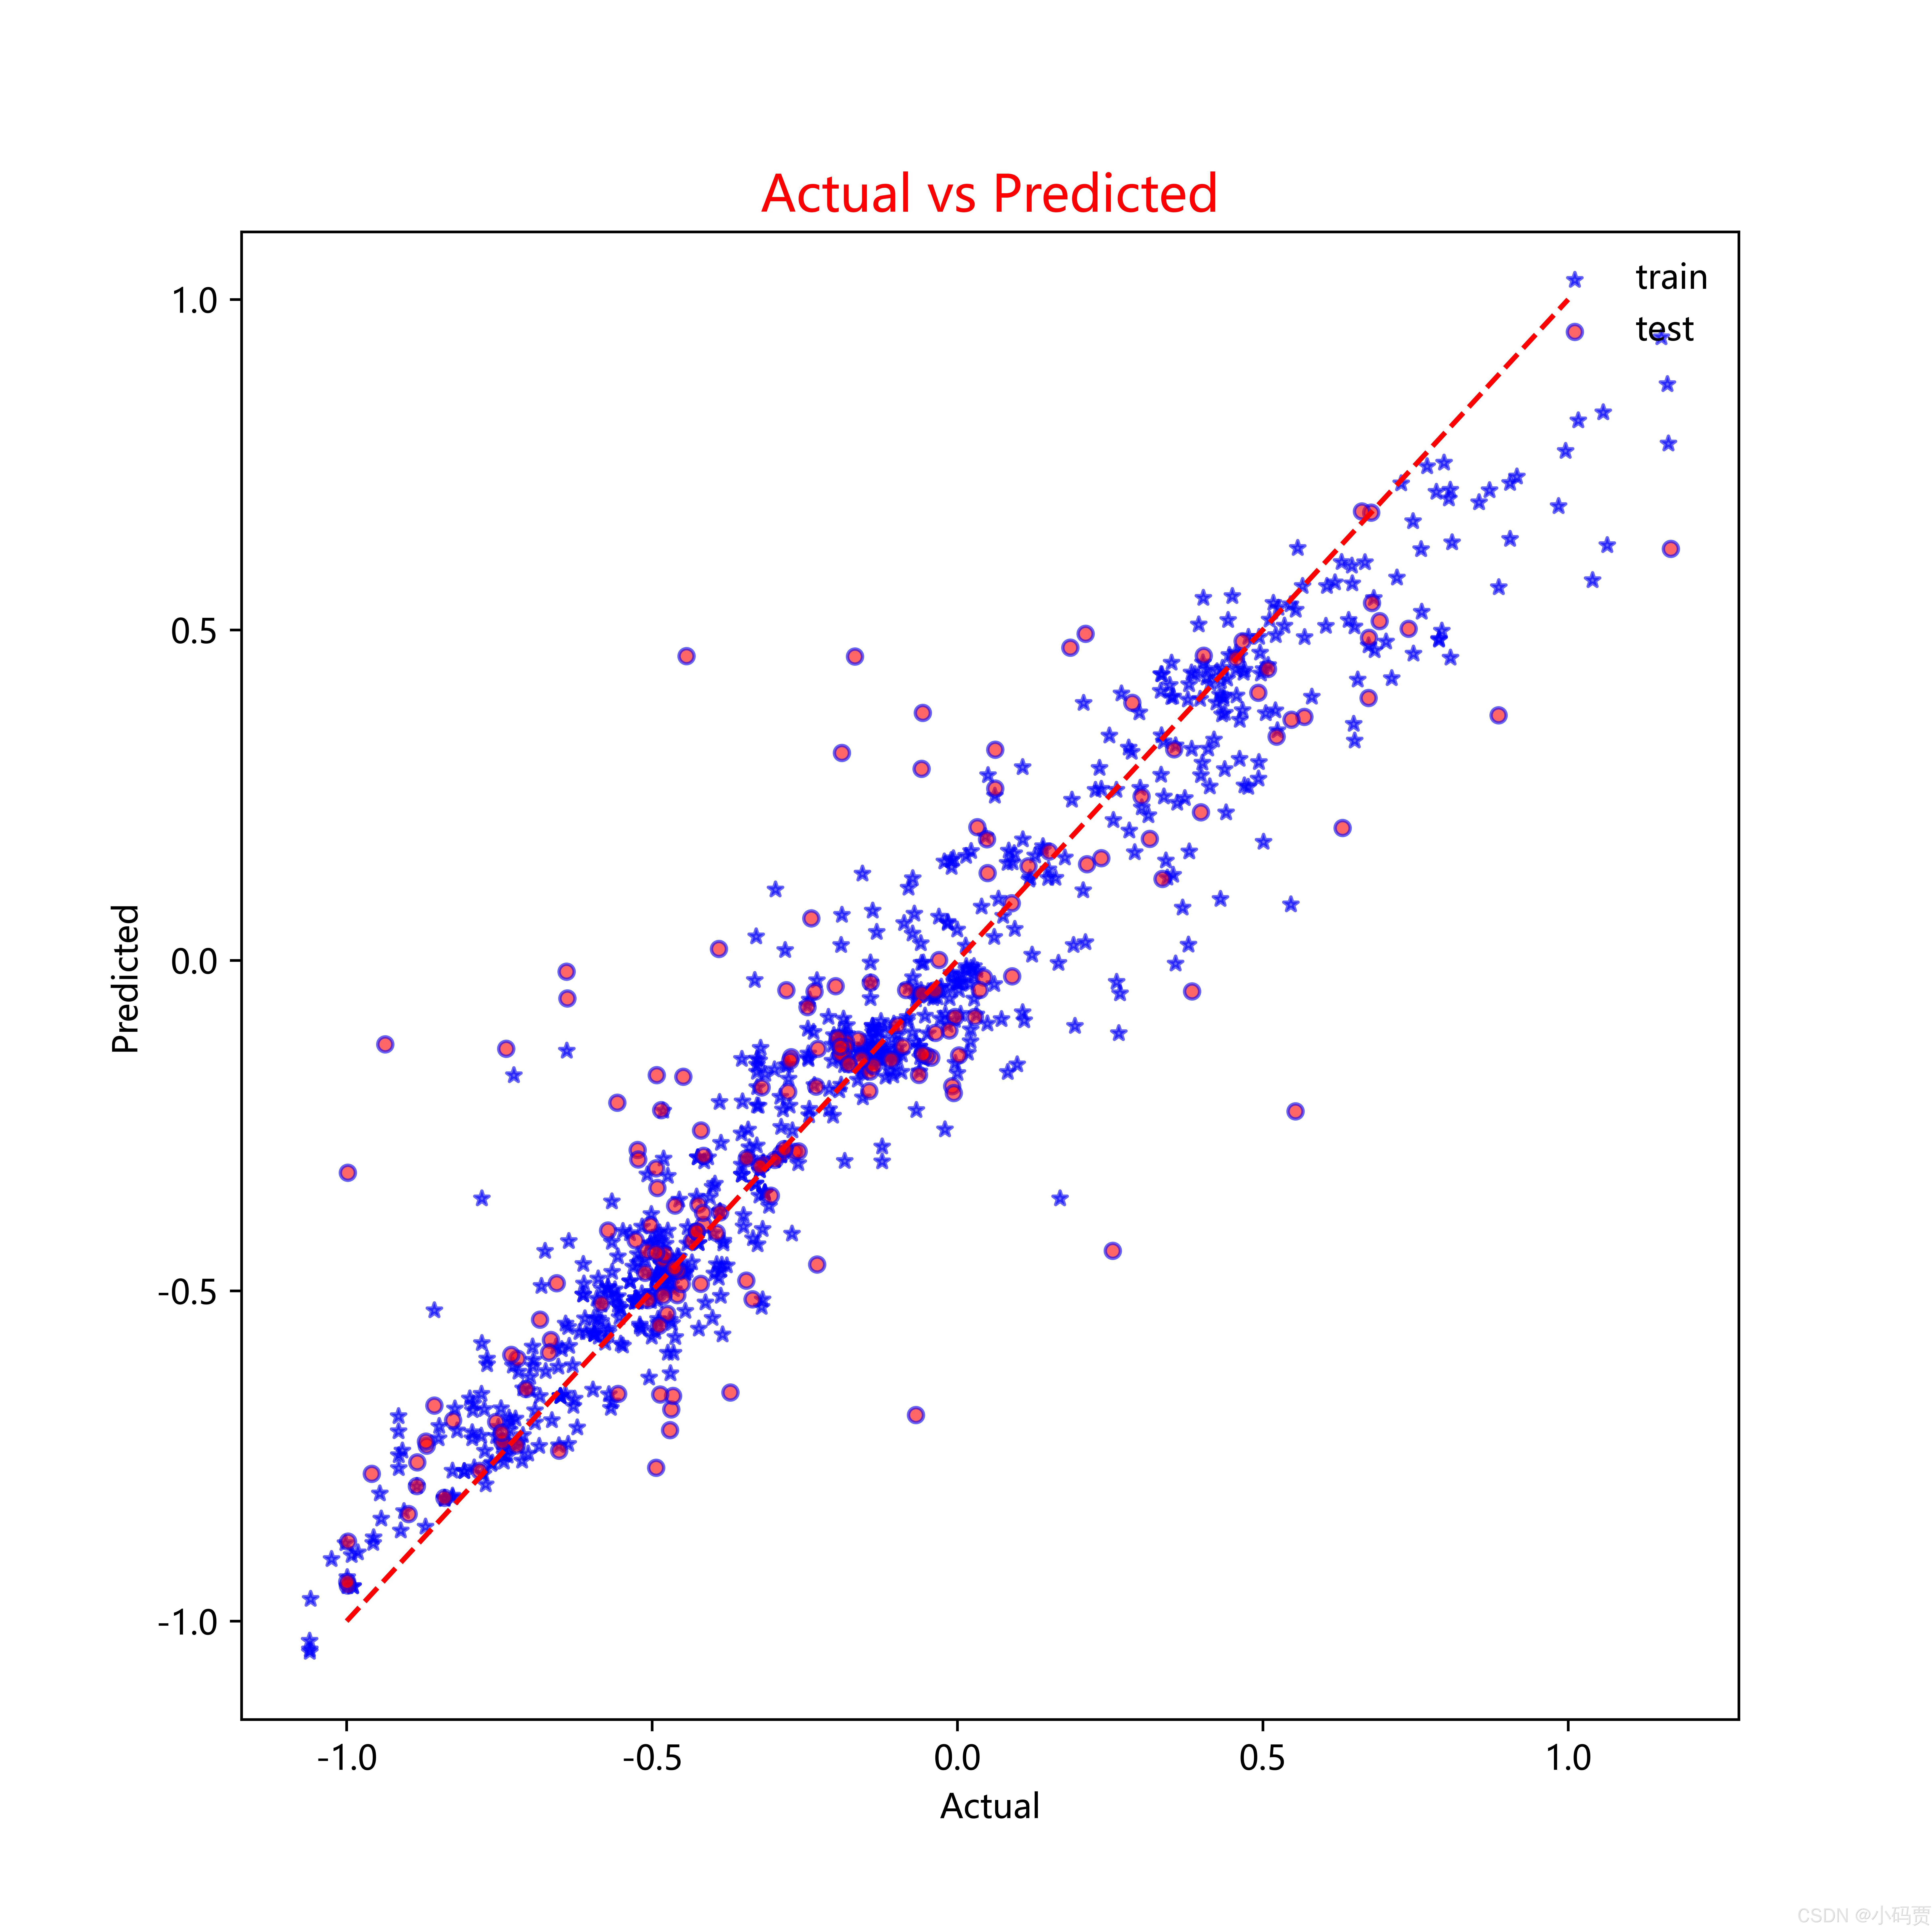
MSE(Train):0.014
MSE(Test):0.052
R^2(Train):0.932
R^2(Test):0.718
2.6 可视化
'''======================结果可视化======================='''
plt.figure(figsize=(8,8))
plt.rcParams['font.sans-serif'] = ['Microsoft YaHei']  # 用来正常显示中文标签
plt.rcParams['axes.unicode_minus'] = False  # 用来正常显示负号
colors = ['b', 'r']  # 设置颜色
markers = ["*","o"]  # 设置点的形状
Y_train_picture = [y_train,y_test]          #可视化图的x轴数据
Y_pred_picture = [y_pred_train,y_pred_test] #可视化图的y轴数据
for i in range(0,2):
    plt.scatter(Y_train_picture[i],
                Y_pred_picture[i],
                s = 20,  # 表示点的大小
                c = colors[i],  # 颜色
                marker = markers[i],  # 点的形状
                edgecolors='b',  # 散点边框颜色
                alpha=0.6)  # 透明度
plt.plot([-1.0,1.0],[-1.0,1.0],'r--')  #可视化图数据范围
plt.xlabel('Actual')     #x轴标签
plt.ylabel('Predicted')  #y轴标签
plt.legend(['train', 'test'], loc='upper right',frameon=False) #图例,位置位于右上方,去掉图例边框
plt.title('Actual vs Predicted',fontsize=15, c='r')
# 将图保存为*.jpg图
plt.savefig('./RFR_可视化.jpg',dpi = 1200) #在当前文件夹下保存jpg格式图,dpi = 1200
plt.show()
此图表示,数据点越靠近中间红线模型越好。
三、代码全部注释
'''====================导入Python库===================='''
import pandas as pd               #python科学计算库
import numpy as np                #Python的一个开源数据分析处理库。
import matplotlib.pyplot as plt   #常用Python画图工具
from sklearn.ensemble import RandomForestRegressor  # 导入 RandomForestRegressor 模型
from sklearn.model_selection import train_test_split # 数据划分模块
from sklearn.preprocessing import StandardScaler   # 标准化模块
from sklearn.metrics import mean_squared_error, r2_score   #误差函数MSE,误差函数R^2,
from sklearn.model_selection import GridSearchCV     #超参数网格搜索

'''========================导入数据========================'''
data = pd.read_excel('D:/复现/trainset_loop6.xlsx')  #读取xlsx格式数据
# date = pd.read_csv('D:/复现/trainset_loop6.csv')   #读取csv格式数据
print(data.isnull().sum())   #检查数据中是否存在缺失值
print(data.shape)   #检查维度
print(data.columns) #数据的标签
data = data.drop(["PN","AN"], axis = 1) #axis = 1表示对列进行处理,0表示对行
Y, X = data['Eads'] , data.drop(['Eads'] , axis = 1) #对Y、X分别赋值

'''=========================标准化========================'''
#利用StandardScaler函数对X进行标准化处理
scaler = StandardScaler()
X = scaler.fit_transform(X)
'''====================划分训练集与测试集==================='''
X_train,X_test,y_train,y_test = train_test_split(X , Y , test_size=0.2 , random_state=42)


'''=======================模型训练========================'''
#模型训练
model = RandomForestRegressor()   # 模型实例化。
'''======================超参数======================='''
#n_estimators: 树模型个数
# criterion: “mse”来选择最合适的节点。
# splitter: ”best” or “random”(default=”best”)随机选择属性还是选择不纯度最大的属性,建议用默认。
# max_features: 选择最适属性时划分的特征不能超过此值。
# 当为整数时,即最大特征数;
# 当为小数时,训练集特征数*小数;
# if “auto”, then max_features=sqrt(n_features).
# If “sqrt”, thenmax_features=sqrt(n_features).
# If “log2”, thenmax_features=log2(n_features).
# If None, then max_features=n_features.
# max_depth: (default=None)设置树的最大深度,默认为None,这样建树时,会使每一个叶节点只有一个类别,或是达到min_samples_split。
# min_samples_split: 根据属性划分节点时,每个划分最少的样本数。
# min_samples_leaf: 叶子节点最少的样本数。
# max_leaf_nodes: (default=None)叶子树的最大样本数。
# min_weight_fraction_leaf: (default=0) 叶子节点所需要的最小权值
# verbose: (default=0) 是否显示任务进程


# 定义超参数网格。
n_estimators = [300,500,700,900]
max_depth = [4,5,6,7,8,9]
# min_samples_leaf = [1,3,5,7,9,11]  #有点费时间就没加这个超参数,想加的可以加,(不加可能会有点过拟合)。
# 网格搜索,cv = 5表示进行5折交叉验证
grid_search = GridSearchCV(estimator = model,cv = 5, param_grid={'max_depth': max_depth,"n_estimators":n_estimators}, scoring='neg_mean_squared_error')
grid_search.fit(X_train, y_train)
# 最佳模型
best_model = grid_search.best_estimator_
# 最佳超参数
best_max_depth = grid_search.best_params_['max_depth']
# best_min_samples_leaf = grid_search.best_params_['min_samples_leaf']
best_n_estimators = grid_search.best_params_['n_estimators']
print(f'Best max_depth:{best_max_depth:.3f}',"\n",f'Best n_estimators:{best_n_estimators:.3f}')

'''=======================模型预测========================'''
# best_model模型预测
y_pred_train = best_model.predict(X_train)
y_pred_test = best_model.predict(X_test)
#评估
mse_train=mean_squared_error(y_train,y_pred_train)  #均方误差越小模型越好
mse_test=mean_squared_error(y_test,y_pred_test)     #R2 表示模型对因变量的解释能力,取值范围从 0 ~ 1,越接近 1 表示模型对数据的拟合程度越好。
r2_train=r2_score(y_train,y_pred_train)
r2_test=r2_score(y_test,y_pred_test)
print(f'MSE(Train):{mse_train:.3f}')  #保留2位小数
print(f'MSE(Test):{mse_test:.3f}')
print(f'R^2(Train):{r2_train:.3f}')
print(f'R^2(Test):{r2_test:.3f}')


'''======================结果可视化======================='''
plt.figure(figsize=(8,8))
plt.rcParams['font.sans-serif'] = ['Microsoft YaHei']  # 用来正常显示中文标签
plt.rcParams['axes.unicode_minus'] = False  # 用来正常显示负号
colors = ['b', 'r']  # 设置颜色
markers = ["*","o"]  # 设置点的形状
Y_train_picture = [y_train,y_test]          #可视化图的x轴数据
Y_pred_picture = [y_pred_train,y_pred_test] #可视化图的y轴数据
for i in range(0,2):
    plt.scatter(Y_train_picture[i],
                Y_pred_picture[i],
                s = 20,  # 表示点的大小
                c = colors[i],  # 颜色
                marker = markers[i],  # 点的形状
                edgecolors='b',  # 散点边框颜色
                alpha=0.6)  # 透明度
plt.plot([-1.0,1.0],[-1.0,1.0],'r--')  #可视化图数据范围
plt.xlabel('Actual')     #x轴标签
plt.ylabel('Predicted')  #y轴标签
plt.legend(['train', 'test'], loc='upper right',frameon=False) #图例,位置位于右上方,去掉图例边框
plt.title('Actual vs Predicted',fontsize=15, c='r')
# 将图保存为*.jpg图
plt.savefig('./RFR_可视化.jpg',dpi = 1200) #在当前文件夹下保存jpg格式图,dpi = 1200
plt.show()
其中,有几个点,需要大家注意下~
优点:
-
高准确度:通过集成学习方法,随机森林通常比单个决策树具有更高的预测准确度。
-
防止过拟合:通过对多个子集和特征进行训练,降低了模型的过拟合风险。
-
可处理高维数据:适用于高维特征的数据集。
缺点:
-
计算开销大:训练多个决策树需要较高的计算成本,尤其在数据集较大时。
-
可解释性差:由于是集成模型,难以解释单个预测的逻辑。
持续更新中。。。 


 2361
2361

 被折叠的 条评论
为什么被折叠?


