


重点
VennDiagram包绘制韦恩图
#韦恩图的绘制(最少两组,最多五组)
install.packages("VennDiagram")
library(VennDiagram)
listA <- read.csv("Rdata/genes_list_A.txt",header=FALSE)
A <- listA$V1
listB <- read.csv("Rdata/genes_list_B.txt",header=FALSE)
B <- listB$V1
listC <- read.csv("Rdata/genes_list_C.txt",header=FALSE)
C <- listC$V1
listD <- read.csv("Rdata/genes_list_D.txt",header=FALSE)
D <- listD$V1
listE <- read.csv("Rdata/genes_list_E.txt",header=FALSE)
E <- listE$V1#将每个List的v1赋予给对应变量
length(A);length(B);length(C);length(D);length(E)#判断数据的个数
library(VennDiagram)#VennDiagram函数输入的是一个列表
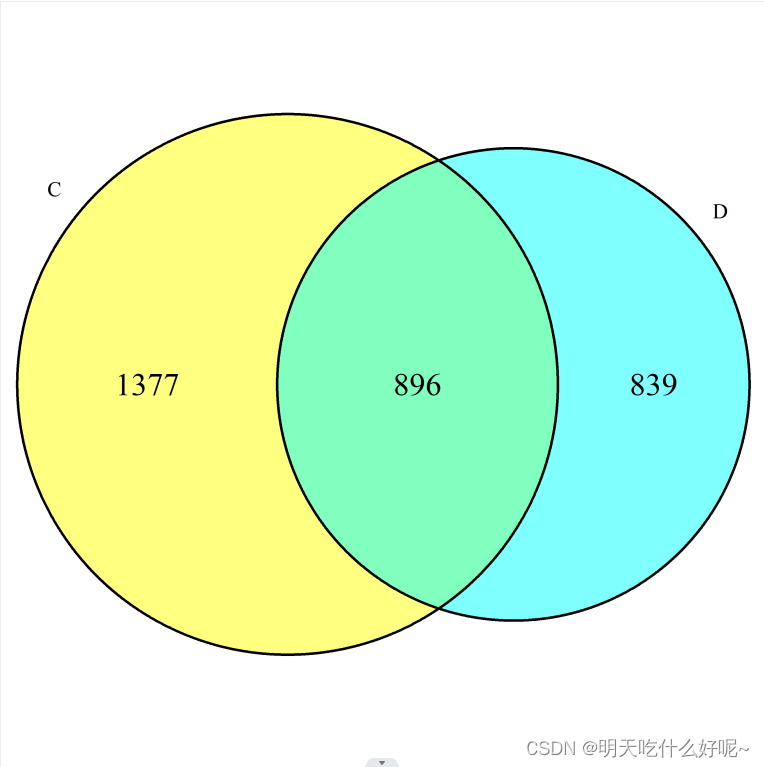
venn.diagram(list(C = C, D = D),fill = c("yellow","cyan"), cex = 1.5,filename = "venn2.png")#绘制两个样品的Venn图C=c前边是名称后边是向量,fill指用什么颜色填充,cex指样品名和标签的放大倍数
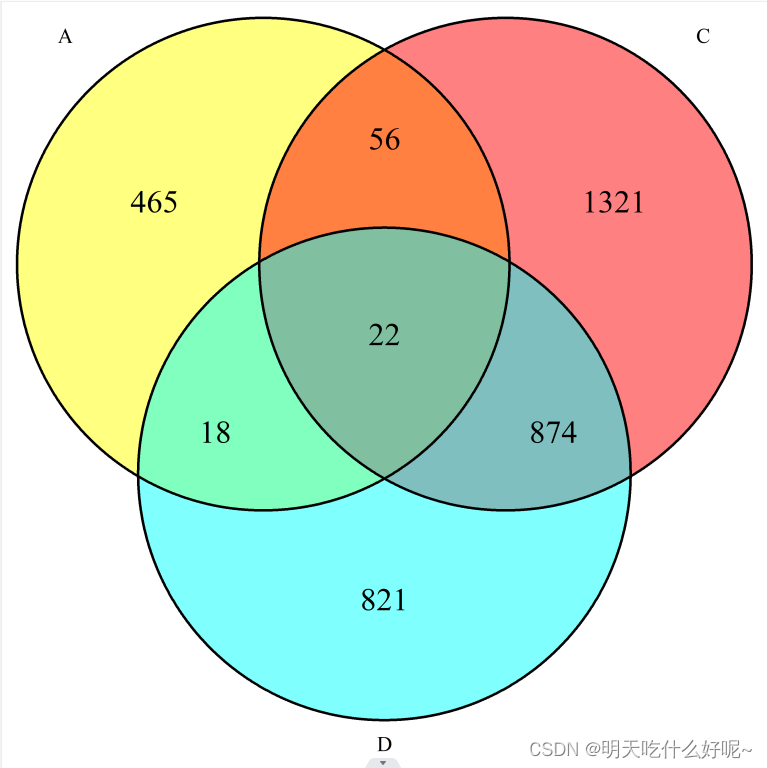
venn.diagram(list(A = A, C = C, D = D), fill = c("yellow","red","cyan"), cex = 1.5,filename="venn3.png")
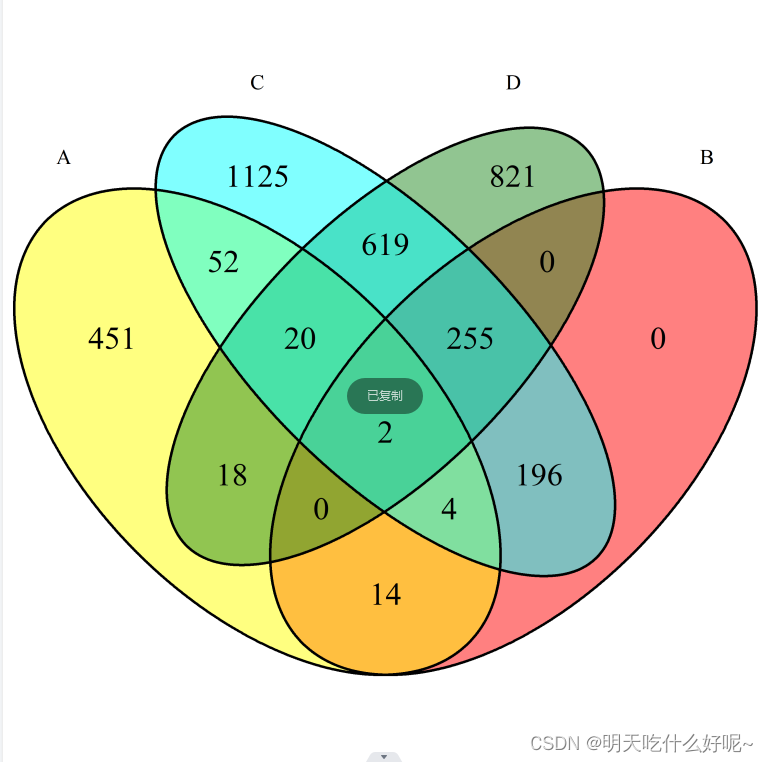
venn.diagram(list(A = A, B = B, C = C, D = D), fill = c("yellow","red","cyan","forestgreen"), cex = 1.5,filename="venn4.png")
venn.diagram(list(A = A, B = B, C = C, D = D , E = E ), fill = c("yellow","red","cyan","forestgreen","lightblue"), cex = 1.5,filename="venn5.png")
结果如下:


 350
350


 被折叠的 条评论
为什么被折叠?
被折叠的 条评论
为什么被折叠?
 到【灌水乐园】发言


