


Pyecharts是一个用于生成 Echarts 图表的 Python 库。Echarts 是一个基于 JavaScript 的数据可视化库,提供了丰富的图表类型和交互功能。通过 Pyecharts,你可以使用 Python 代码生成各种类型的 Echarts 图表,例如折线图、柱状图、饼图、散点图等。
from pyecharts.charts import Scatter
from pyecharts import options as opts
import numpy as np
from scipy.interpolate import griddata
x = np.random.uniform(0, 10, 100)
y = np.random.uniform(0, 10, 100)
z = np.random.uniform(0, 10, 100)
xi = np.linspace(0, 10, 100)
yi = np.linspace(0, 10, 100)
xi, yi = np.meshgrid(xi, yi)
zi = griddata((x, y), z, (xi, yi), method='linear')
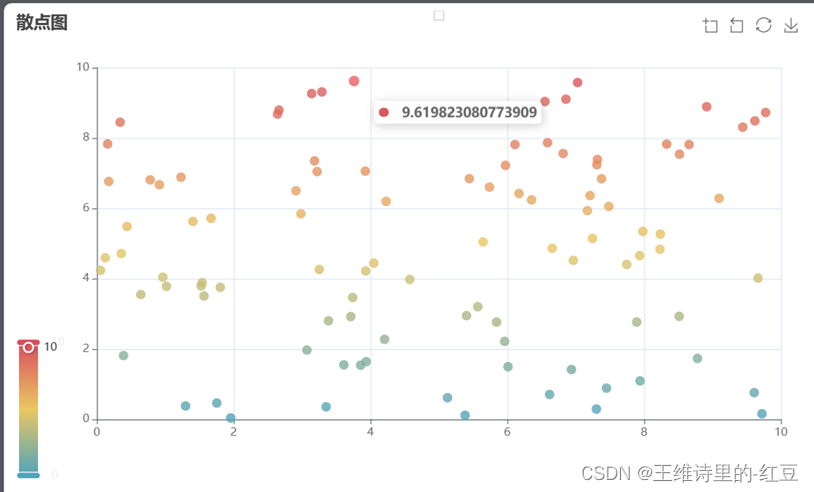
sca = (
Scatter()
.set_global_opts(
title_opts=opts.TitleOpts(title="散点图"),
visualmap_opts=opts.VisualMapOpts(type_="color", max_=10, min_=0),
toolbox_opts=opts.ToolboxOpts(
is_show=True,
feature={
"dataZoom": {"show": True, "yAxisIndex": "none"},
"restore": {"show": True},
"saveAsImage": {"show": True},
},
),
)
.add_xaxis(x)
.add_yaxis("", y, symbol_size=10, label_opts=opts.LabelOpts(is_show=False))
)
sca.render("散点图.html")运行结果如下


 1665
1665


 被折叠的 条评论
为什么被折叠?
被折叠的 条评论
为什么被折叠?
 到【灌水乐园】发言


