


 本文介绍了霍兰德的职业兴趣自测理论,由JohnHolland提出,将人格分为研究型、艺术型等六个维度,帮助个体理解自己与不同职业类型的匹配度。通过数据示例展示了如何通过雷达图进行人格分析,以支持职业规划。
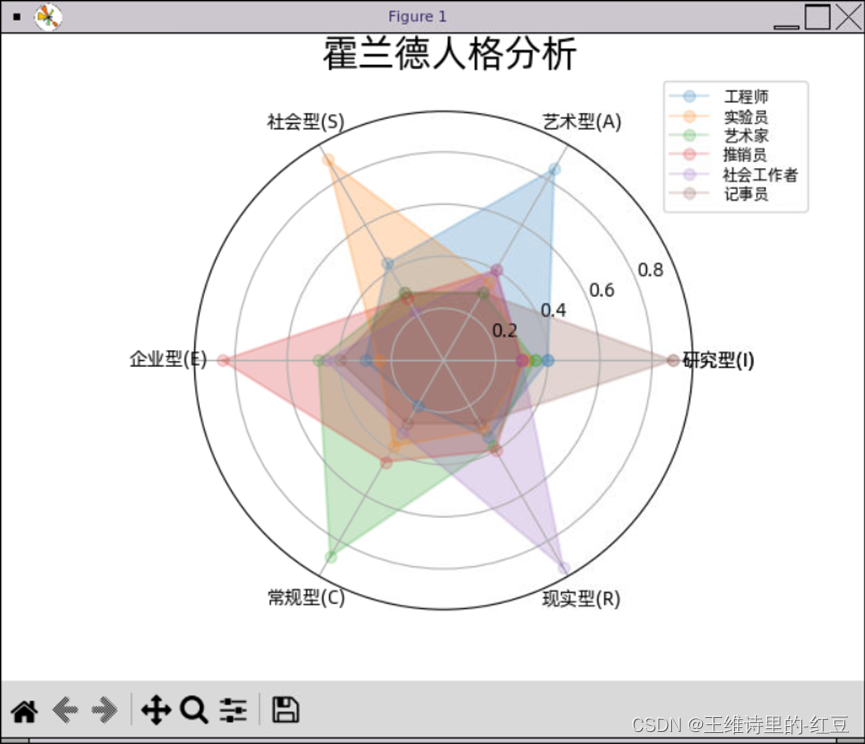
霍兰德职业兴趣自测(Self-Directed Search)是由美国职业指导专家霍兰德(John Holland)根据他本人大量的职业咨询经验及其职业类型理论编制的测评工具。霍兰德认为,个人职业兴趣特性与职业之间应有一种内在的对应关系。根据兴趣的不同,人格可分为研究型(I)、艺术型(A)、社会型(S)、企业型(E)、传统型(C)、现实型(R)六个维度,每个人的性格都是这六个维度的不同程度组合。
import numpy as np
import matplotlib.pyplot as plt
import matplotlib
matplotlib.rcParams['font.family'] = 'Alibaba PuHuiTi 2.0'
matplotlib.rcParams['font.sans-serif'] = ['Alibaba PuHuiTi 2.0']
radar_labels = np.array(['研究型(I)', '艺术型(A)', '社会型(S)', \
                        '企业型(E)', '常规型(C)', '现实型(R)'])
nAttr = 6
data = np.array([[0.40, 0.32, 0.35, 0.30, 0.30, 0.88],
                [0.85, 0.35, 0.30, 0.40, 0.40, 0.30],
                [0.43, 0.89, 0.30, 0.28, 0.22, 0.30],
                [0.30, 0.25, 0.48, 0.85, 0.45, 0.40],
                [0.20, 0.38, 0.87, 0.45, 0.32, 0.28],
                [0.34, 0.31, 0.38, 0.40, 0.92, 0.28]])
data_labels = ('工程师', '实验员', '艺术家', '推销员', '社会工作者', '记事员')
angles = np.linspace(0, 2 * np.pi, nAttr, endpoint = False)
data = np.concatenate((data, [data[0]]))
angles = np.concatenate((angles, [angles[0]]))
radar_labels = np.concatenate((radar_labels, [radar_labels[0]]))
fig = plt.figure(facecolor = "white")
plt.subplot(111, polar = True)
plt.plot(angles, data, 'o-', linewidth = 1.5, alpha = 0.2)
plt.fill(angles, data, alpha = 0.25)
plt.thetagrids(angles * 180 / np.pi, radar_labels)
plt.figtext(0.52, 0.95, '霍兰德人格分析', ha='center', size = 20)
legend = plt.legend(data_labels, loc=(0.94, 0.80), labelspacing = 0.1)
plt.setp(legend.get_texts(), fontsize = 'small')
plt.grid(True)
plt.savefig('holland_radar.JPG')
plt.show()
运行结果如下


 1598
1598

 被折叠的 条评论
为什么被折叠?
被折叠的 条评论
为什么被折叠?
 到【灌水乐园】发言


