import numpy as np
import matplotlib.pyplot as plt
# 0.【设置中文字体】
plt.rcParams["font.sans-serif"] = ["SimHei"]
plt.rcParams["axes.unicode_minus"] = False
# 1.1 准备数据
year_x = np.arange(2014, 2022, 1)  # X轴刻度值(2014-2021)
data_speed = np.array([7.40, 4.00, 5.83, 5.81, 5.16, 8.63, -9.13, 13.66])  # 同比增速
data_num = np.array([87430, 90912, 96225, 101885, 107147, 116390, 105764, 120215])  # 诊疗量


# 1.2 创建第一个坐标系实例
ax = plt.subplot2grid((2, 3), (0, 0), colspan=3)

# 1.3 在第一个坐标系实例上绘制堆积柱形图
bar = ax.bar(year_x, data_num, width=0.5, color='orange')

# 1.4 创建共享x轴的第二个坐标系实例
ax_right = ax.twinx()

# 1.5 在第二个坐标系实例绘制折线图
line = ax_right.plot(year_x, data_speed, 'm^-')

# 1.6 图表辅助元素定制
ax.set_ylabel('诊疗量 (万人次)')
ax_right.set_ylabel('同比增速(%)')
ax.set_title('2014-2021年中国中医类医疗卫生机构诊疗量')
ax_right.set_ylim(-20, 20)
# 2.1 准备数据
ratios = [2.2, 27.9, 56.2, 10.9, 2.8]  # 各年龄段用户比例
labels = ['20岁以下', '20-30岁', '31-40岁', '41-50岁', '51岁以上']  # 外侧说明文字

# 2.2 创建坐标系实例并绘制饼图
ax2 = plt.subplot2grid((2, 3), (1, 0))
ax2.pie(ratios, labels=labels, radius=1.5,
        textprops={'fontsize': 6},  # 表示控制图表中文本属性的字典
        wedgeprops={'width': 0.75},  # 表示控制扇形或楔形的属性的字典
        pctdistance=0.75,  # 调整数值标签的位置
        autopct='%3.1f%%',  # 控制扇形或楔形的数值显示的字符串
        startangle=0)  # 调整购物品类的位置

# 2.3 图表辅助元素定制
ax2.set_title('中药材消费者画像', fontsize=8, pad=20)
# 3.1 准备数据
xlabels = ['2019年', '2020年', '2021年', '2022年', '2023年']
year_x = np.arange(2019, 2024, 1)  # X轴刻度值(2019-2023)
data1 = np.array([20.3, 22.0, 23.5, 22.5, 22.3])  # 跨国企业占比
data2 = np.array([79.7, 78.0, 76.5, 77.5, 77.7])  # 本土企业占比


# 3.2 创建坐标系实例并绘制堆积柱形图
ax3 = plt.subplot2grid((2, 3), (1, 1))
bar_width = 0.5  # 柱宽
ax3.bar(year_x, data1, width=bar_width)
ax3.bar(year_x, data2, bottom=data1, width=bar_width)

# 3.3 图表辅助元素定制
ax3.set_title('全国药店中药饮片供应商占比', fontsize=6)
ax3.set_xticks(year_x)
ax3.set_xticklabels(xlabels, rotation=60, fontsize=8)
# 4.1 准备数据
score = np.array([33, 45, 3, 9, 10])  # 各品类药品占比
score = np.concatenate((score, [score[0]]))  # 拼接一下,构成闭环

radar_labels = ['化学药', '中成药', '生物制品', '保健品', '中药饮片']  # 维度标签
radar_labels = np.concatenate((radar_labels, [radar_labels[0]]))  # 拼接一下,构成闭环

dim_num = len(score) - 1  # 维度数
radians = np.linspace(0, 2 * np.pi, dim_num, endpoint=False)
radians = np.concatenate((radians, [radians[0]]))

# 4.2 创建极坐标系实例,并绘制雷达图
ax4 = plt.subplot2grid((2, 3), (1, 2), polar=True)
ax4.plot(radians, score, marker='o',
         markersize=2, linewidth=1, color='r')

# 4.3 图表辅助元素定制
# 设置极坐标的标签
angles = radians * 180 / np.pi  # 弧度转角度
ax4.set_thetagrids(angles, labels=radar_labels, fontsize=6)  # 设置新的刻度标签
# 填充多边形
ax4.fill(radians, score, alpha=0.2)
ax4.set_title('全国药店药品销售额占比', fontsize=8, pad=20)
plt.tight_layout() # 启用自动紧凑布局
plt.show()
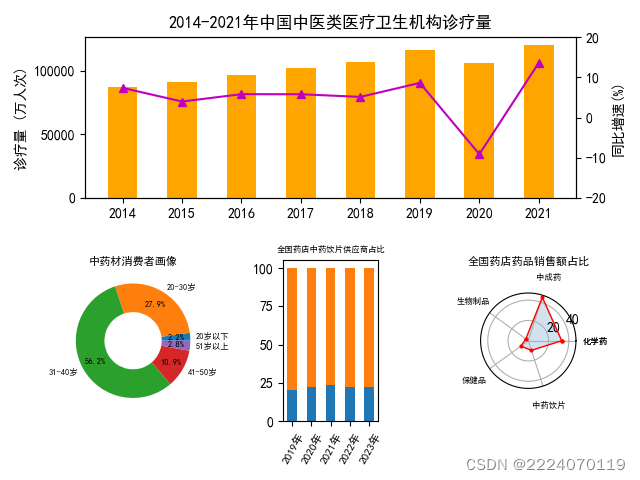


 本文使用Python的matplotlib库展示了2014-2021年中国中医类医疗卫生机构的诊疗量变化以及中药材消费者年龄分布,同时分析了2019-2023年药店中药饮片供应商占比和药品销售额的雷达图。


 420
420

 被折叠的 条评论
为什么被折叠?
被折叠的 条评论
为什么被折叠?
 到【灌水乐园】发言


