


1.目的:
1.掌握利用Python语言及相关库编写K-means聚类分析模型的方法。
2.能利用Python语言及相关库编写DBSCAN算法。
2.内容:
编写代码,采用两种聚类方法对以下数据进行聚类分析,并进行适当的可视化展示。
// name calories sodium alcohol cost
Budweiser 144 15 4.7 0.43
Schlitz 151 19 4.9 0.43
Lowenbrau 157 15 0.9 0.48
Kronenbourg 170 7 5.2 0.73
Heineken 152 11 5.0 0.77
Old_Milwaukee 145 23 4.6 0.28
Augsberger 175 24 5.5 0.40
Srohs_Bohemian_Style 149 27 4.7 0.42
Miller_Lite 99 10 4.3 0.43
Budweiser_Light 113 8 3.7 0.40
Coors 140 18 4.6 0.44
Coors_Light 102 15 4.1 0.46
Michelob_Light 135 11 4.2 0.50
Becks 150 19 4.7 0.76
Kirin 149 6 5.0 0.79
Pabst_Extra_Light 68 15 2.3 0.38
Hamms 139 19 4.4 0.43
Heilemans_Old_Style 144 24 4.9 0.43
Olympia_Goled_Light 72 6 2.9 0.46
Schlitz_Light 97 7 4.2 0.47
3.代码实现
import pandas as pd
import numpy as np
from sklearn.cluster import KMeans, DBSCAN
import matplotlib.pyplot as plt
from sklearn.preprocessing import StandardScaler
from sklearn.decomposition import PCA
# 加载数据
data = {
'name': ['Budweiser', 'Schlitz', 'Lowenbrau', 'Kronenbourg', 'Heineken', 'Old_Milwaukee', 'Augsberger',
'Srohs_Bohemian_Style', 'Miller_Lite', 'Budweiser_Light', 'Coors', 'Coors_Light',
'Michelob_Light', 'Becks', 'Kirin', 'Pabst_Extra_Light', 'Hamms', 'Heilemans_Old_Style',
'Olympia_Goled_Light', 'Schlitz_Light'],
'calories': [144, 151, 157, 170, 152, 145, 175, 149, 99, 113, 140, 102, 135, 150, 149, 68, 139, 144, 72, 97],
'sodium': [15, 19, 15, 7, 11, 23, 24, 27, 10, 8, 18, 15, 11, 19, 6, 15, 19, 24, 6, 7],
'alcohol': [4.7, 4.9, 0.9, 5.2, 5.0, 4.6, 5.5, 4.7, 4.3, 3.7, 4.6, 4.1, 4.2, 4.7, 5.0, 2.3, 4.4, 4.9, 2.9, 4.2],
'cost': [0.43, 0.43, 0.48, 0.73, 0.77, 0.28, 0.40, 0.42, 0.43, 0.40, 0.44, 0.46, 0.50, 0.76, 0.79, 0.38, 0.43, 0.43,
0.46, 0.47]
}
df = pd.DataFrame(data)
# 标准化数据
scaler = StandardScaler()
scaled_features = scaler.fit_transform(df[['calories', 'sodium', 'alcohol', 'cost']])
# 使用PCA降维以便可视化
pca = PCA(n_components=2)
principalComponents = pca.fit_transform(scaled_features)
# K-means聚类
kmeans = KMeans(n_clusters=3, random_state=0)
kmeans.fit(scaled_features)
df['kmeans_cluster'] = kmeans.labels_
# DBSCAN聚类
dbscan = DBSCAN(eps=0.3, min_samples=5)
dbscan.fit(scaled_features)
df['dbscan_cluster'] = dbscan.labels_
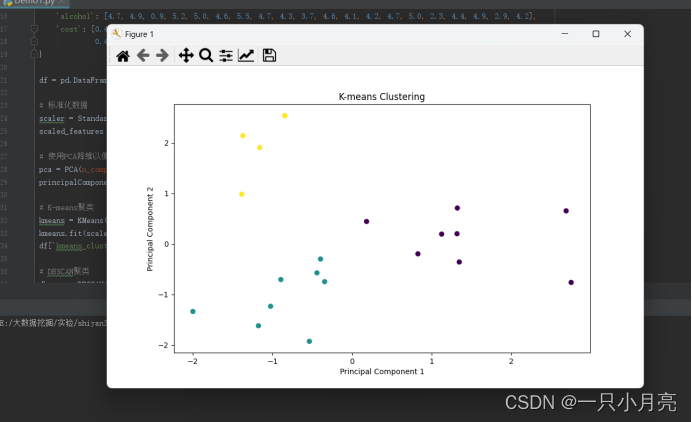
# 可视化K-means聚类结果
plt.figure(figsize=(10, 6))
plt.scatter(principalComponents[:, 0], principalComponents[:, 1], c=df['kmeans_cluster'], cmap='viridis')
plt.title('K-means Clustering')
plt.xlabel('Principal Component 1')
plt.ylabel('Principal Component 2')
plt.show()
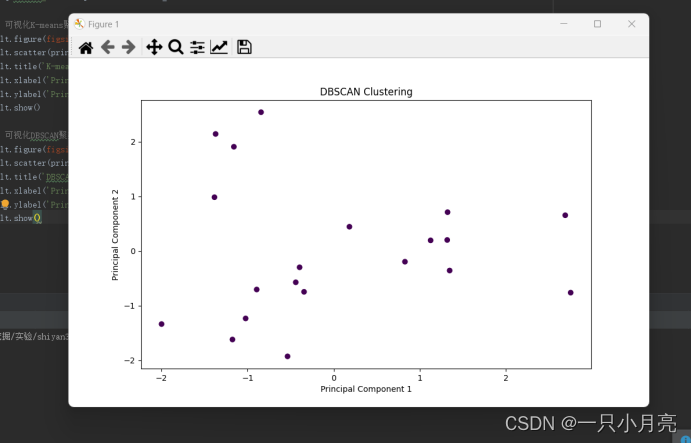
# 可视化DBSCAN聚类结果
plt.figure(figsize=(10, 6))
plt.scatter(principalComponents[:, 0], principalComponents[:, 1], c=df['dbscan_cluster'], cmap='viridis')
plt.title('DBSCAN Clustering')
plt.xlabel('Principal Component 1')
plt.ylabel('Principal Component 2')
plt.show()4.结果展示
4.1K-means聚类分析模型
4.2 DBSCAN聚类分析模型


 4043
4043

 被折叠的 条评论
为什么被折叠?
被折叠的 条评论
为什么被折叠?
 到【灌水乐园】发言


