


matplotlib中文网: https://www.matplotlib.org
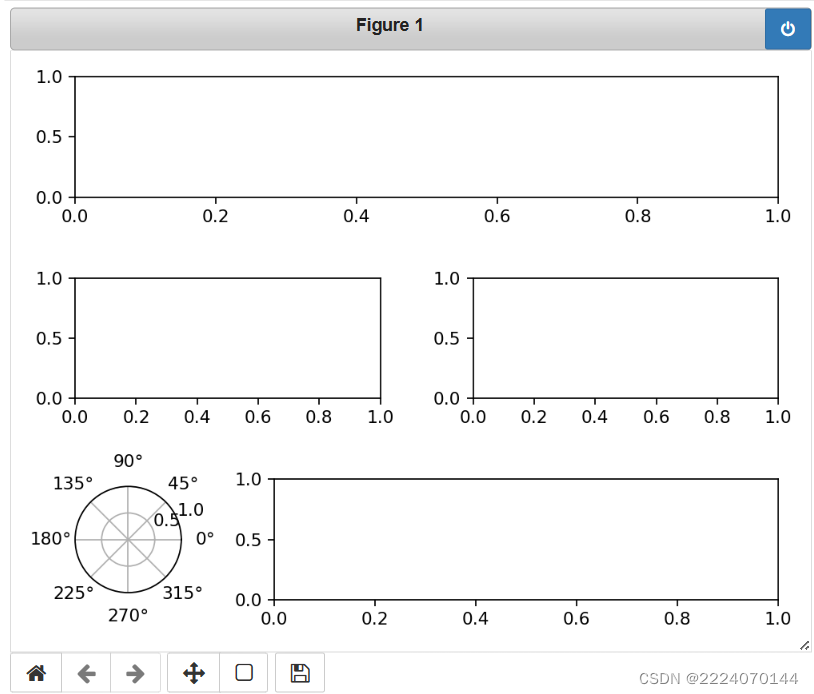
# 需求一:利用自定义布局的GridSpec实例,在画布上创建如图所示的坐标系实例(见运行结果展示图)

%matplotlib notebook
import matplotlib.pyplot as plt

#1.创建画布实例
fig = plt.figure()

#2.创建“区域规划图”实例
gs = gridspec.GridSpec(3,4,figure=fig)

#3.根据给定的“区域规划图”,创建对应的坐标系实例
fi_ax1 = fig.add_subplot(gs[0,:])
fi_ax2 = fig.add_subplot(gs[1,:-2])
fi_ax3 = fig.add_subplot(gs[1,2:])
fi_ax4 = fig.add_subplot(gs[2,0],projection='polar')
fi_ax5 = fig.add_subplot(gs[2,1:4])

#设置紧密布局
plt.tight_layout()

#展示图例
plt.show()
运行效果如下图所示


 148
148


 被折叠的 条评论
为什么被折叠?
被折叠的 条评论
为什么被折叠?
 到【灌水乐园】发言


