


subplot分图展示
- 均匀分图
matplotlib 是可以组合许多的小图, 放在一张大图里面显示的. 使用到的方法叫作 subplot.
使用import导入matplotlib.pyplot模块, 并简写成plt. 使用plt.figure创建一个图像窗口.
import matplotlib.pyplot as plt
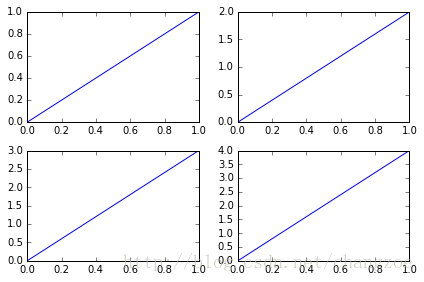
plt.figure()使用plt.subplot来创建小图. plt.subplot(2,2,1)表示将整个图像窗口分为2行2列, 当前位置为1. 使用plt.plot([0,1],[0,1])在第1个位置创建一个小图.
plt.subplot(2,2,2)表示将整个图像窗口分为2行2列, 当前位置为2. 使用plt.plot([0,1],[0,2])在第2个位置创建一个小图.
plt.subplot(2,2,3)表示将整个图像窗口分为2行2列,当前位置为3. plt.subplot(2,2,3)可以简写成plt.subplot(223), matplotlib同样可以识别. 使用plt.plot([0,1],[0,3])在第3个位置创建一个小图.
plt.subplot(224)表示将整个图像窗口分为2行2列, 当前位置为4. 使用plt.plot([0,1],[0,4])在第4个位置创建一个小图.
plt.subplot(2, 2, 1)

plt.plot([0, 1], [0, 1])


plt.subplot(222)

plt.plot([0, 1], [0, 2])


plt.subplot(223)

plt.plot([0, 1], [0, 3])


plt.subplot(224)

plt.plot([0, 1], [0, 4])


plt.tight_layout()
- 不均匀图中图
如果希望展示的小图的大小不相同, 应该怎么做呢? 以上面的4个小图为例, 如果把第1个小图放到第一行, 而剩下的3个小图都放到第二行.
使用plt.subplot(2,1,1)将整个图像窗口分为2行1列, 当前位置为1. 使用plt.plot([0,1],[0,1])在第1个位置创建一个小图.
plt.subplot(2,1,1)
plt.plot([0,1],[0,1])
使用plt.subplot(2,3,4)将整个图像窗口分为2行3列, 当前位置为4. 使用plt.plot([0,1],[0,2])在第4个位置创建一个小图.
plt.subplot(2,3,4)
plt.plot([0,1],[0,2])
这里需要解释一下为什么第4个位置放第2个小图. 上一步中使用plt.subplot(2,1,1)将整个图像窗口分为2行1列, 第1个小图占用了第1个位置, 也就是整个第1行. 这一步中使用plt.subplot(2,3,4)将整个图像窗口分为2行3列, 于是整个图像窗口的第1行就变成了3列, 也就是成了3个位置, 于是第2行的第1个位置是整个图像窗口的第4个位置.
使用plt.subplot(235)将整个图像窗口分为2行3列,当前位置为5. 使用plt.plot([0,1],[0,3])在第5个位置创建一个小图. 同上, 再创建plt.subplot(236).
plt.subplot(235)
plt.plot([0,1],[0,3])

plt.subplot(236)
plt.plot([0,1],[0,4])

plt.show()  # 展示
完整代码:
# -*- coding: utf-8 -*-
"""
Created on Tue Dec 19 17:39:56 2017

@author: elenawang
"""

import matplotlib.pyplot as plt


plt.figure(figsize=(6, 4))

# plt.subplot(n_rows, n_cols, plot_num)

plt.subplot(2, 2, 1)

plt.plot([0, 1], [0, 1])


plt.subplot(222)

plt.plot([0, 1], [0, 2])


plt.subplot(223)

plt.plot([0, 1], [0, 3])


plt.subplot(224)

plt.plot([0, 1], [0, 4])


plt.tight_layout()


# example 2:

###############################

plt.figure(figsize=(6, 4))

# plt.subplot(n_rows, n_cols, plot_num)

plt.subplot(2, 1, 1)

# figure splits into 2 rows, 1 col, plot to the 1st sub-fig

plt.plot([0, 1], [0, 1])


plt.subplot(234)

# figure splits into 2 rows, 3 col, plot to the 4th sub-fig

plt.plot([0, 1], [0, 2])


plt.subplot(235)

# figure splits into 2 rows, 3 col, plot to the 5th sub-fig

plt.plot([0, 1], [0, 3])


plt.subplot(236)

# figure splits into 2 rows, 3 col, plot to the 6th sub-fig

plt.plot([0, 1], [0, 4])


plt.tight_layout()

plt.show()
subplot分格展示
- subplot2grid
使用import导入matplotlib.pyplot模块, 并简写成plt. 使用plt.figure()创建一个图像窗口
import matplotlib.pyplot as plt
plt.figure()
ax1 = plt.subplot2grid((3, 3), (0, 0), colspan=3) # stands for axes
ax1.plot([1, 2], [1, 2])
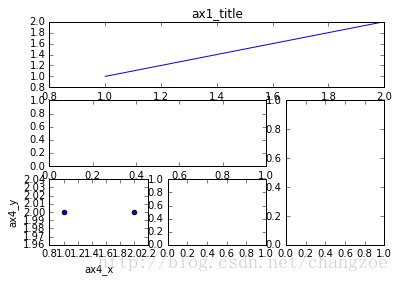
ax1.set_title('ax1_title')使用plt.subplot2grid来创建第1个小图, (3,3)表示将整个图像窗口分成3行3列, (0,0)表示从第0行第0列开始作图,colspan=3表示列的跨度为3, rowspan=1表示行的跨度为1. colspan和rowspan缺省, 默认跨度为1.
使用plt.subplot2grid来创建第2个小图, (3,3)表示将整个图像窗口分成3行3列, (1,0)表示从第1行第0列开始作图,colspan=2表示列的跨度为2. 同上画出 ax3, (1,2)表示从第1行第2列开始作图,rowspan=2表示行的跨度为2. 再画一个 ax4 和 ax5, 使用默认 colspan, rowspan.
ax2 = plt.subplot2grid((3, 3), (1, 0), colspan=2)

ax3 = plt.subplot2grid((3, 3), (1, 2), rowspan=2)

ax4 = plt.subplot2grid((3, 3), (2, 0))
ax4.scatter([1, 2], [2, 2])

ax4.set_xlabel('ax4_x')

ax4.set_ylabel('ax4_y')

ax5 = plt.subplot2grid((3, 3), (2, 1))
使用ax4.scatter创建一个散点图, 使用ax4.set_xlabel和ax4.set_ylabel来对x轴和y轴命名.
- gridspec
使用import导入matplotlib.pyplot模块, 并简写成plt. 使用import导入matplotlib.gridspec, 并简写成gridspec.
用plt.figure()创建一个图像窗口, 使用gridspec.GridSpec将整个图像窗口分成3行3列.
plt.figure()
import matplotlib.pyplot as plt

import matplotlib.gridspec as gridspec

plt.figure()

gs = gridspec.GridSpec(3, 3)
使用plt.subplot来作图, gs[0, :]表示这个图占第0行和所有列, gs[1, :2]表示这个图占第1行和第2列前的所有列, gs[1:, 2]表示这个图占第1行后的所有行和第2列, gs[-1, 0]表示这个图占倒数第1行和第0列, gs[-1, -2]表示这个图占倒数第1行和倒数第2列.
ax6 = plt.subplot(gs[0, :])

ax6.plot([0,1],[1,2])

ax7 = plt.subplot(gs[1, :2])

ax8 = plt.subplot(gs[1:, 2])

ax8.plot([0,1],[0,6])

ax9 = plt.subplot(gs[-1, 0])

ax9.scatter([0,1],[0,3])

ax10 = plt.subplot(gs[-1, -2])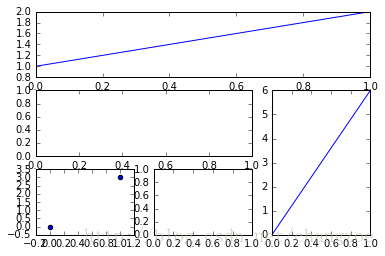
- subplots
使用plt.subplots建立一个2行2列的图像窗口,sharex=True表示共享x轴坐标, sharey=True表示共享y轴坐标. ((ax11, ax12), (ax13, ax14))表示第1行从左至右依次放ax11和ax12, 第2行从左至右依次放ax13和ax14.
f, ((ax11, ax12), (ax13, ax14)) = plt.subplots(2, 2, sharex=True, sharey=True)

ax11.scatter([1,2], [1,2])

ax14.plot([3,5],[1,2])
plt.tight_layout()表示紧凑显示图像, plt.show()表示显示图像.
plt.tight_layout()

plt.show()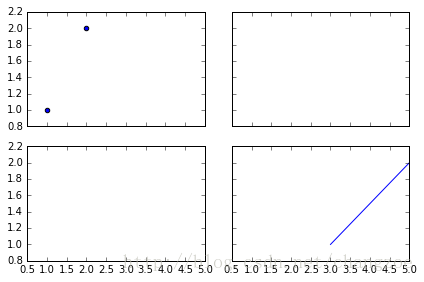


 208
208

 被折叠的 条评论
为什么被折叠?
被折叠的 条评论
为什么被折叠?
 到【灌水乐园】发言


