


-
绘制2*2的子图
-
绘制不规则子图
-
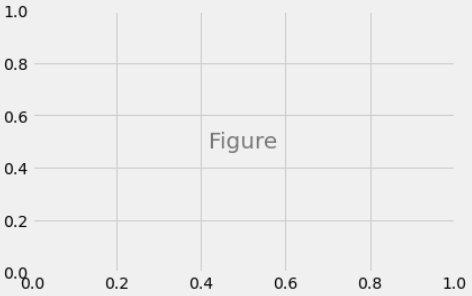
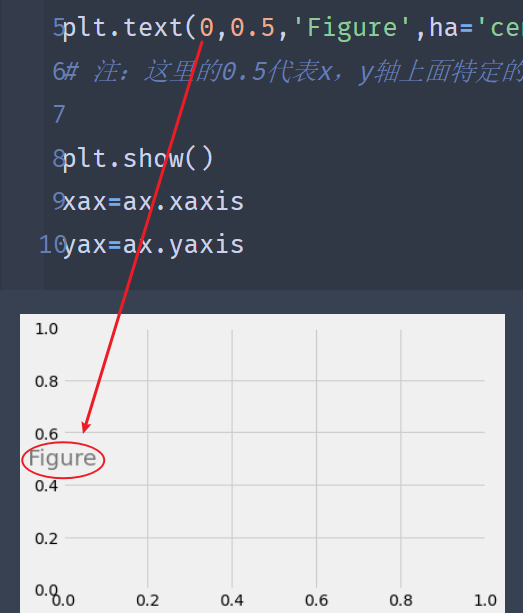
绘制图中代码
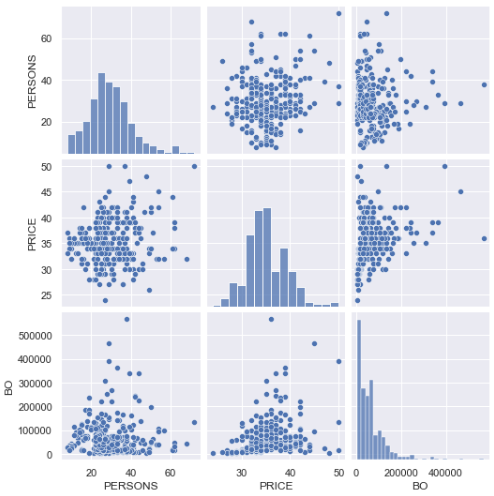
关于上面这张图的效果,请移步:python seaborn
from matplotlib import pyplot as plt
plt.style.use(‘fivethirtyeight’)
fig=plt.figure()
ax=fig.add_subplot(1,1,1)
plt.text(0.5,0.5,‘Figure’,ha=‘center’,va=‘center’,size=20,alpha=0.5)
注:这里的0.5代表x,y轴上面特定的点坐标,ha和va则代表水平和垂直,ha和va可以确保数据绝对居中
plt.show()
xax=ax.xaxis
yax=ax.yaxis
====&
 最低0.47元/天 解锁文章


 3594
3594


 被折叠的 条评论
为什么被折叠?
被折叠的 条评论
为什么被折叠?
 到【灌水乐园】发言


