


需求:写一个多网页的网站,包括header、footer、菜单包括主页home、博客blog(外部链接到博客)、about(自我介绍页面)
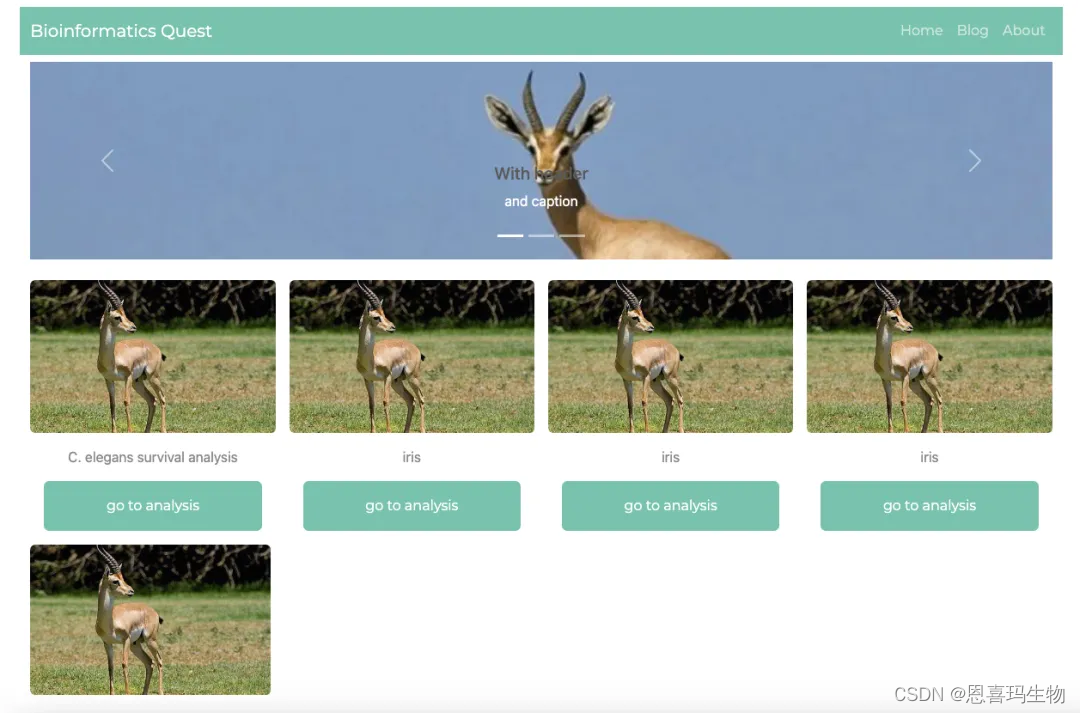
home页面包括一个旋转木马(几张图片循环播放)、再下边单个APP点击后进入可以分析)。
其中第一个APP是shiny APP,用外部网址链接到shiny网站,其他APP是DASH 示例APP。
网站大概满足了功能需求,但是美化细节还没做到...
源代码文件夹
├── app.py
├── pages
│ ├── about.py
│ ├── home.py
│ ├── iris.py
│ └── not_found_404.py
└── static
├── about.md
└── images
├── profile.jpg
└── slide0.jpg
主要APP入口
import dash
from dash import Dash, dcc, html, Input, Output, callback
import plotly.express as px
import dash_bootstrap_components as dbc
dbc_css = "https://cdn.jsdelivr.net/gh/AnnMarieW/dash-bootstrap-templates@V1.0.4/dbc.min.css"
app = Dash(__name__, external_stylesheets=[dbc.themes.MINTY, dbc_css], use_pages=True)
navbar = dbc.NavbarSimple(
[
dbc.NavItem(dbc.NavLink("Home", href="/")),
dbc.NavItem(dbc.NavLink("Blog", href="https://www.baidu.com")),
dbc.NavItem(dbc.NavLink("About", href="/about")),
],
brand="Bioinformatics Quest",
brand_href="#",
color="primary",
dark=True,
)
app.layout = dbc.Container(
[
dbc.Row(dbc.Col(navbar,width=8),class_name="d-flex justify-content-center mt-2 mb-2"),
dbc.Row(
dbc.Col(
dash.page_container,
width=8,
# style={"height": "85vh"}
)
,class_name="mh-100 d-flex justify-content-center"
),
dbc.Row(
html.Footer("2023 Bioinformatics Quest All Right Reserved.",className="d-flex justify-content-center")
,class_name="d-flex justify-content-center"
)
],
fluid=True,
# class_name="grid gap-0 row-gap-3"
)
if __name__ == "__main__":
app.run_server(debug=True)
home页面
每个页面都需要用dash.register_page(name, path='/') 声明是一个页面,path='/'设置路径为根路径
import dash
from dash import html, dcc
import dash_bootstrap_components as dbc
dash.register_page(__name__, path='/')
carousel = dbc.Carousel(
items=[
{
"key": "1",
"src": "/static/images/slide1.jpg",
"header": "With header ",
"caption": "and caption",
},
{
"key": "2",
"src": "/static/images/slide1.jpg",
"header": "With header only",
"caption": "",
},
{
"key": "3",
"src": "/static/images/slide1.jpg",
"header": "",
"caption": "This slide has a caption only",
},
],
class_name="vw-30",
# style={"maxWidth": "600px"},
ride="carousel"
)
def make_card(txt,img,href):
_card = dbc.Card(
[
# dbc.CardHeader(header, style={'textAlign':'center'}),
dbc.CardImg(src="/static/images/"+img,className="img-fluid rounded-start col-md-2"),
dbc.CardBody(
[
html.P(txt, style={'textAlign':'center'}),
dbc.Button("go to analysis", color="primary",href=href, class_name="d-flex justify-content-center p-3"),
],
),
],
className="border-0 bg-transparent g-col-3",
# style={"width": "12rem"},
)
return _card
layout = dbc.Container(
[
dbc.Row(carousel,class_name="h-25"),
html.Br(),
dbc.Row(
dbc.CardGroup(
[
make_card(txt="C. elegans survival analysis",img="slide0.jpg",href='https://bioquest.shinyapps.io/cesa'),
make_card(txt="iris",img="slide0.jpg",href="/iris"),
make_card(txt="iris",img="slide0.jpg",href="/iris"),
make_card(txt="iris",img="slide0.jpg",href="/iris"),
],
class_name = "grid gap-3"
),
# class_name="d-flex justify-content-center"
),
dbc.Row(
[
dbc.Col(
make_card(txt="iris",img="slide0.jpg",href="/iris"),width=3,
)
]
)
],
)
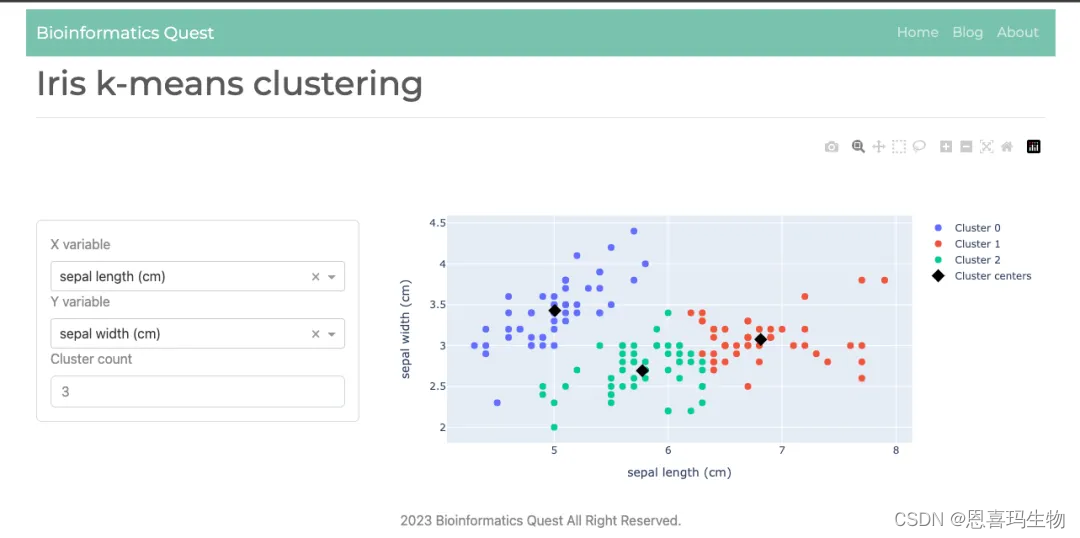
DASH APP
dash.register_page(name)声明网址为 py文件名,即点击go analysis后跳转到http://127.0.0.1:8050/iris 因为文件名为iris.py
如果在子页面写callback需要把app.layout和@app.callback中的app去掉
import dash
import dash_bootstrap_components as dbc
import pandas as pd
import plotly.graph_objs as go
from dash import Input, Output, dcc, html, callback
from sklearn import datasets
from sklearn.cluster import KMeans
iris_raw = datasets.load_iris()
iris = pd.DataFrame(iris_raw["data"], columns=iris_raw["feature_names"])
dash.register_page(__name__)
controls = dbc.Card(
[
html.Div(
[
dbc.Label("X variable"),
dcc.Dropdown(
id="x-variable",
options=[
{"label": col, "value": col} for col in iris.columns
],
value="sepal length (cm)",
),
]
),
html.Div(
[
dbc.Label("Y variable"),
dcc.Dropdown(
id="y-variable",
options=[
{"label": col, "value": col} for col in iris.columns
],
value="sepal width (cm)",
),
]
),
html.Div(
[
dbc.Label("Cluster count"),
dbc.Input(id="cluster-count", type="number", value=3),
]
),
],
body=True,
)
layout = dbc.Container(
[
html.H1("Iris k-means clustering"),
html.Hr(),
dbc.Row(
[
dbc.Col(controls, md=4),
dbc.Col(dcc.Graph(id="cluster-graph"), md=8),
],
align="center",
),
],
fluid=True,
)
@callback(
Output("cluster-graph", "figure"),
[
Input("x-variable", "value"),
Input("y-variable", "value"),
Input("cluster-count", "value"),
],
)
def make_graph(x, y, n_clusters):
# minimal input validation, make sure there's at least one cluster
km = KMeans(n_clusters=max(n_clusters, 1))
df = iris.loc[:, [x, y]]
km.fit(df.values)
df["cluster"] = km.labels_
centers = km.cluster_centers_
data = [
go.Scatter(
x=df.loc[df.cluster == c, x],
y=df.loc[df.cluster == c, y],
mode="markers",
marker={"size": 8},
name="Cluster {}".format(c),
)
for c in range(n_clusters)
]
data.append(
go.Scatter(
x=centers[:, 0],
y=centers[:, 1],
mode="markers",
marker={"color": "#000", "size": 12, "symbol": "diamond"},
name="Cluster centers",
)
)
layout = {"xaxis": {"title": x}, "yaxis": {"title": y}}
return go.Figure(data=data, layout=layout)
# make sure that x and y values can't be the same variable
def filter_options(v):
"""Disable option v"""
return [
{"label": col, "value": col, "disabled": col == v}
for col in iris.columns
]
# functionality is the same for both dropdowns, so we reuse filter_options
callback(Output("x-variable", "options"), [Input("y-variable", "value")])(
filter_options
)
callback(Output("y-variable", "options"), [Input("x-variable", "value")])(
filter_options
)
import dash
from dash import html, dcc
import dash_bootstrap_components as dbc
dash.register_page(__name__)
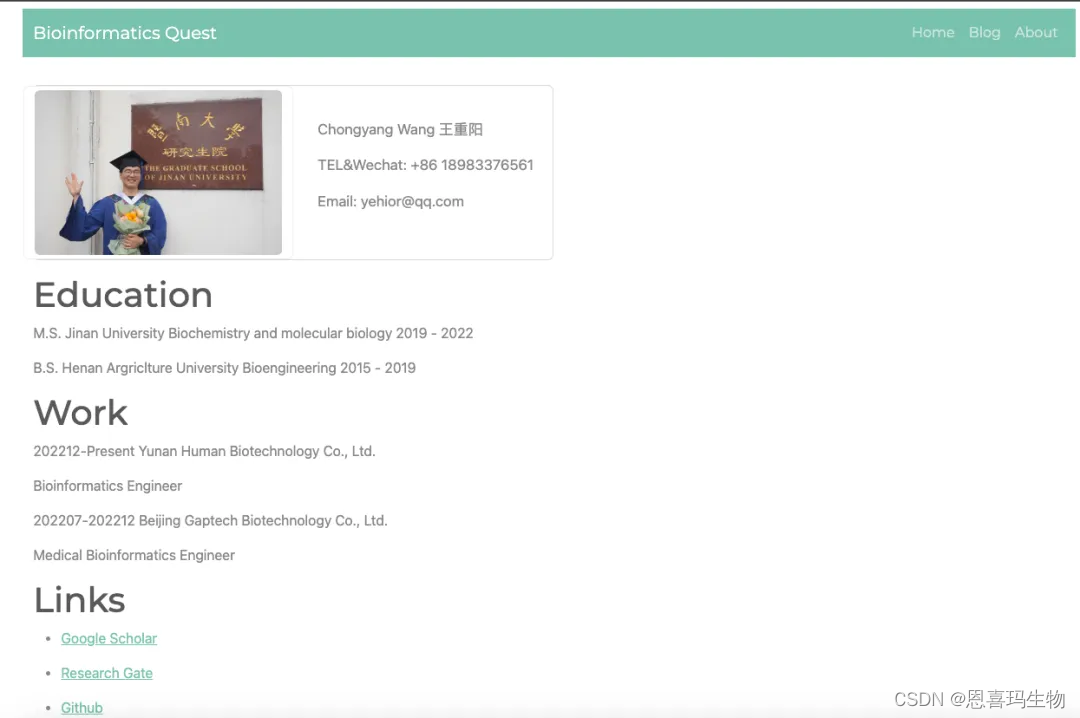
card_about = dbc.Card(
[
dbc.Row(
[
dbc.Col(
dbc.CardImg(
src="/static/images/profile.jpg",
className="img-fluid rounded-start",
),
className="col-md-6 img-thumbnail mx-auto d-block",
),
dbc.Col(
dbc.CardBody(
[
html.P("Chongyang Wang 王重阳"),
html.P("TEL&Wechat: +86 18983376561"),
html.P("Email: yehior@qq.com"),
],
class_name = "font-weight-bold",
style={"font-size": "17px"},
),
className="col-md-6 d-flex align-items-center",
),
],
className="",
)
],
className="mb-3 w-90",
style={"maxWidth": "600px"},
outline=True
)
md_text = open("static/about.md", encoding='utf-8').readlines()
layout = dbc.Container(
[
html.Br(),
card_about,
dcc.Markdown(md_text)
]
)
Reference
https://github.com/AnnMarieW/dash-multi-page-app-demos
https://dash.plotly.com/urls
https://github.com/ucg8j/awesome-dash
http://dash-bootstrap-components.opensource.faculty.ai/docs/themes/explorer/
https://www.youtube.com/watch?v=pJMZ0r84Rqs
https://www.youtube.com/watch?v=Hc9_-ncr4nU
https://www.youtube.com/watch?v=MtSgh6FOL7I
https://www.runoob.com/bootstrap5/bootstrap5-tutorial.html


 780
780


 被折叠的 条评论
为什么被折叠?
被折叠的 条评论
为什么被折叠?
 到【灌水乐园】发言


