


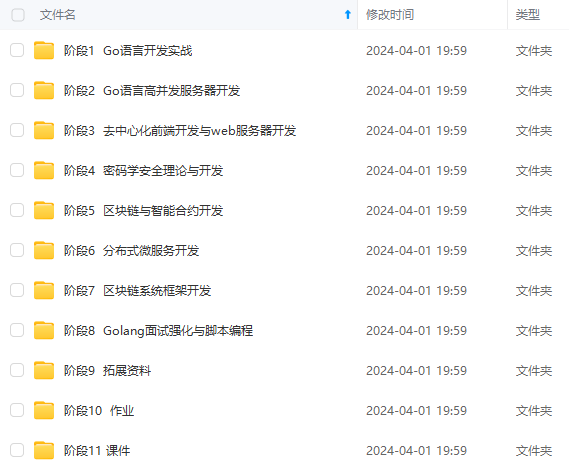

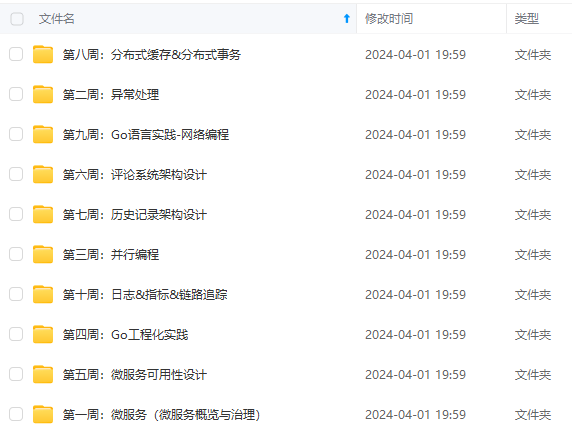
既有适合小白学习的零基础资料,也有适合3年以上经验的小伙伴深入学习提升的进阶课程,涵盖了95%以上Go语言开发知识点,真正体系化!
由于文件比较多,这里只是将部分目录截图出来,全套包含大厂面经、学习笔记、源码讲义、实战项目、大纲路线、讲解视频,并且后续会持续更新
统计每秒块I/O时间的数量:
funccount-bpfcc -i 1 't:block:\*'
展示每秒新创建的进程数量:
funccount-bpfcc -i 1 t:sched:sched_process_fork
展示每秒libc中的getaddrinfo函数的调用次数:
funccount-bpfcc -i c:getaddrinfo
对libgo中全部的os.*调用进行计数:
funccount-bpfcc 'go:os.\*'
源码
#!/usr/bin/python
# @lint-avoid-python-3-compatibility-imports
#
# funccount Count functions, tracepoints, and USDT probes.
# For Linux, uses BCC, eBPF.
#
# USAGE: funccount [-h] [-p PID] [-i INTERVAL] [-d DURATION] [-T] [-r]
# [-c CPU] pattern
#
# The pattern is a string with optional '\*' wildcards, similar to file
# globbing. If you'd prefer to use regular expressions, use the -r option.
#
# Copyright (c) 2015 Brendan Gregg.
# Licensed under the Apache License, Version 2.0 (the "License")
#
# 09-Sep-2015 Brendan Gregg Created this.
# 18-Oct-2016 Sasha Goldshtein Generalized for uprobes, tracepoints, USDT.
from __future__ import print_function
from bcc import ArgString, BPF, USDT
from time import sleep, strftime
import argparse
import re
import signal
import sys
import traceback
debug = False
def verify\_limit(num):
probe_limit = BPF.get_probe_limit()
if num > probe_limit:
raise Exception("maximum of %d probes allowed, attempted %d" %
(probe_limit, num))
class Probe(object):
def \_\_init\_\_(self, pattern, use_regex=False, pid=None, cpu=None):
"""Init a new probe.
Init the probe from the pattern provided by the user. The supported
patterns mimic the 'trace' and 'argdist' tools, but are simpler because
we don't have to distinguish between probes and retprobes.
func -- probe a kernel function
lib:func -- probe a user-space function in the library 'lib'
/path:func -- probe a user-space function in binary '/path'
p::func -- same thing as 'func'
p:lib:func -- same thing as 'lib:func'
t:cat:event -- probe a kernel tracepoint
u:lib:probe -- probe a USDT tracepoint
"""
parts = bytes(pattern).split(b':')
if len(parts) == 1:
parts = [b"p", b"", parts[0]]
elif len(parts) == 2:
parts = [b"p", parts[0], parts[1]]
elif len(parts) == 3:
if parts[0] == b"t":
parts = [b"t", b"", b"%s:%s" % tuple(parts[1:])]
if parts[0] not in [b"p", b"t", b"u"]:
raise Exception("Type must be 'p', 't', or 'u', but got %s" %
parts[0])
else:
raise Exception("Too many ':'-separated components in pattern %s" %
pattern)
(self.type, self.library, self.pattern) = parts
if not use_regex:
self.pattern = self.pattern.replace(b'\*', b'.\*')
self.pattern = b'^' + self.pattern + b'$'
if (self.type == b"p" and self.library) or self.type == b"u":
libpath = BPF.find_library(self.library)
if libpath is None:
# This might be an executable (e.g. 'bash')
libpath = BPF.find_exe(str(self.library))
if libpath is None or len(libpath) == 0:
raise Exception("unable to find library %s" % self.library)
self.library = libpath
self.pid = pid
self.cpu = cpu
self.matched = 0
self.trace_functions = {} # map location number to function name
def is\_kernel\_probe(self):
return self.type == b"t" or (self.type == b"p" and self.library == b"")
# 加载到内核
def attach(self):
if self.type == b"p" and not self.library:
for index, function in self.trace_functions.items():
self.bpf.attach_kprobe(
event=function,
fn_name="trace\_count\_%d" % index)
elif self.type == b"p" and self.library:
for index, function in self.trace_functions.items():
self.bpf.attach_uprobe(
name=self.library,
sym=function,
fn_name="trace\_count\_%d" % index,
pid=self.pid or -1)
elif self.type == b"t":
for index, function in self.trace_functions.items():
self.bpf.attach_tracepoint(
tp=function,
fn_name="trace\_count\_%d" % index)
elif self.type == b"u":
pass # Nothing to do -- attach already happened in `load`
def \_add\_function(self, template, probe_name):
new_func = b"trace\_count\_%d" % self.matched
text = template.replace(b"PROBE\_FUNCTION", new_func)
text = text.replace(b"LOCATION", b"%d" % self.matched)
self.trace_functions[self.matched] = probe_name
self.matched += 1
return text
def \_generate\_functions(self, template):
self.usdt = None
text = b""
if self.type == b"p" and not self.library:
functions = BPF.get_kprobe_functions(self.pattern)
verify_limit(len(functions))
for function in functions:
text += self._add_function(template, function)
elif self.type == b"p" and self.library:
# uprobes are tricky because the same function may have multiple
# addresses, and the same address may be mapped to multiple
# functions. We aren't allowed to create more than one uprobe
# per address, so track unique addresses and ignore functions that
# map to an address that we've already seen. Also ignore functions
# that may repeat multiple times with different addresses.
addresses, functions = (set(), set())
functions_and_addresses = BPF.get_user_functions_and_addresses(
self.library, self.pattern)
verify_limit(len(functions_and_addresses))
for function, address in functions_and_addresses:
if address in addresses or function in functions:
continue
addresses.add(address)
functions.add(function)
text += self._add_function(template, function)
elif self.type == b"t":
tracepoints = BPF.get_tracepoints(self.pattern)
verify_limit(len(tracepoints))
for tracepoint in tracepoints:
text += self._add_function(template, tracepoint)
elif self.type == b"u":
self.usdt = USDT(path=str(self.library), pid=self.pid)
matches = []
for probe in self.usdt.enumerate_probes():
if not self.pid and (probe.bin_path != self.library):
continue
if re.match(self.pattern, probe.name):
matches.append(probe.name)
verify_limit(len(matches))
for match in matches:
new_func = b"trace\_count\_%d" % self.matched
text += self._add_function(template, match)
self.usdt.enable_probe(match, new_func)
if debug:
print(self.usdt.get_text())
return text
def load(self):
trace_count_text = b"""
int PROBE\_FUNCTION(void \*ctx) {
FILTERPID
FILTERCPU
int loc = LOCATION;
counts.atomic\_increment(loc);
return 0;
}
"""
bpf_text = b"""#include <uapi/linux/ptrace.h>
BPF\_ARRAY(counts, u64, NUMLOCATIONS);
"""
# We really mean the tgid from the kernel's perspective, which is in
# the top 32 bits of bpf\_get\_current\_pid\_tgid().
if self.pid:
trace_count_text = trace_count_text.replace(b'FILTERPID',
b"""u32 pid = bpf\_get\_current\_pid\_tgid() >> 32;
if (pid != %d) { return 0; }""" % self.pid)
else:
trace_count_text = trace_count_text.replace(b'FILTERPID', b'')
if self.cpu:
trace_count_text = trace_count_text.replace(b'FILTERCPU',
b"""u32 cpu = bpf\_get\_smp\_processor\_id();
if (cpu != %d) { return 0; }""" % int(self.cpu))
else:
trace_count_text = trace_count_text.replace(b'FILTERCPU', b'')
bpf_text += self._generate_functions(trace_count_text)
bpf_text = bpf_text.replace(b"NUMLOCATIONS",
b"%d" % len(self.trace_functions))
if debug:
print(bpf_text)
if self.matched == 0:
raise Exception("No functions matched by pattern %s" %
self.pattern)
self.bpf = BPF(text=bpf_text,
usdt_contexts=[self.usdt] if self.usdt else [])
self.clear() # Initialize all array items to zero
def counts(self):
return self.bpf["counts"]
def clear(self):
counts = self.bpf["counts"]
for location, _ in list(self.trace_functions.items()):
counts[counts.Key(location)] = counts.Leaf()
class Tool(object):
def \_\_init\_\_(self):
examples = """examples:
./funccount 'vfs\_\*' # count kernel fns starting with "vfs"
./funccount -r '^vfs.\*' # same as above, using regular expressions
./funccount -Ti 5 'vfs\_\*' # output every 5 seconds, with timestamps
./funccount -d 10 'vfs\_\*' # trace for 10 seconds only
./funccount -p 185 'vfs\_\*' # count vfs calls for PID 181 only
./funccount t:sched:sched\_fork # count calls to the sched\_fork tracepoint
./funccount -p 185 u:node:gc\* # count all GC USDT probes in node, PID 185
./funccount c:malloc # count all malloc() calls in libc
./funccount go:os.\* # count all "os.\*" calls in libgo
./funccount -p 185 go:os.\* # count all "os.\*" calls in libgo, PID 185

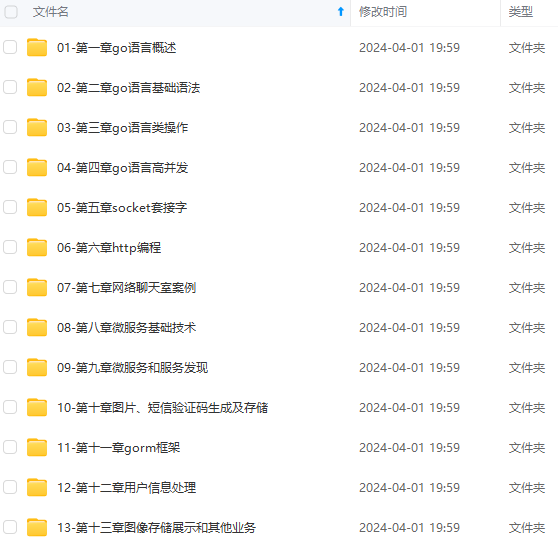

**既有适合小白学习的零基础资料,也有适合3年以上经验的小伙伴深入学习提升的进阶课程,涵盖了95%以上Go语言开发知识点,真正体系化!**
**由于文件比较多,这里只是将部分目录截图出来,全套包含大厂面经、学习笔记、源码讲义、实战项目、大纲路线、讲解视频,并且后续会持续更新**
**[如果你需要这些资料,可以戳这里获取](https://bbs.csdn.net/topics/618658159)**
外链图片转存中...(img-CZBvShQV-1715670590197)]
[外链图片转存中...(img-K70R27qp-1715670590197)]
**既有适合小白学习的零基础资料,也有适合3年以上经验的小伙伴深入学习提升的进阶课程,涵盖了95%以上Go语言开发知识点,真正体系化!**
**由于文件比较多,这里只是将部分目录截图出来,全套包含大厂面经、学习笔记、源码讲义、实战项目、大纲路线、讲解视频,并且后续会持续更新**
**[如果你需要这些资料,可以戳这里获取](https://bbs.csdn.net/topics/618658159)**


 5万+
5万+

 被折叠的 条评论
为什么被折叠?
被折叠的 条评论
为什么被折叠?
 到【灌水乐园】发言


