


packagename:bmV0LmdhbWVkdW8udGJk
聲明:本文內容僅供學習交流之用
前言
淺淺記錄一次對LIAPP的分析過程。
初見反調試
直接打開APP會提示debuggable。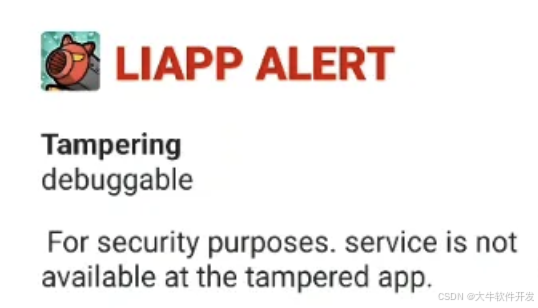
用frida注入後會提示ng1ok-64.so ( 一般的frida應該是frida-agent-64.so )
用frida hook dlopen,發現在閃退前只加載了libdyzzwwc.so,顯然anti frida的邏輯就在這個so中。
查看libdyzzwwc.so的.init_array,看上去有點奇怪。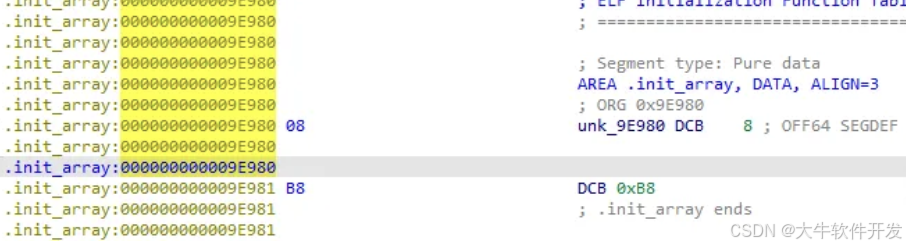
手動按D幫助IDA重新解析,發現靜態分析.init_array只能看到有一個初始化函數,相關檢測邏輯大概就在這裡。
將sub_B8080重命名為init_array_func1。

進入init_array_func1,會發現有些函數調用IDA靜態分析時無法識別,像下圖這樣。
遇到這種情況時,只好動調看看了。

動調分析init_array
注:一些函數是經過我重命名的,並非原本就是這樣。
在動調前要先弄清楚主要的目的:
- 嘗試找到檢測邏輯。
- 熟悉代碼( 相信代碼,代碼就會幫助你 )。
- 尋找字符串解密函數 / 處理字符串的函數。
init_array_func1
從init_array_func1下斷點開始進行動調,一開始先判斷了v1中是否包含.sandbox,不清楚具體檢測的是什麼,或許是一些沙箱環境?
我的環境不會走這條if分支,繼續向下看。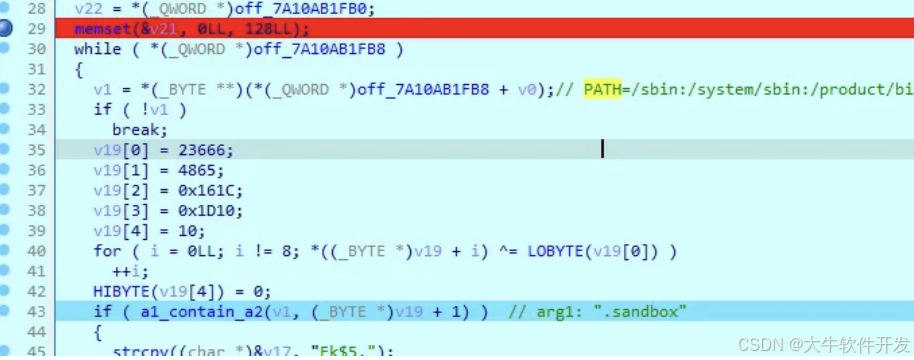
注:v1如下,是從/proc/self/environ裡取的值,while循環會遍歷這其中的所有元素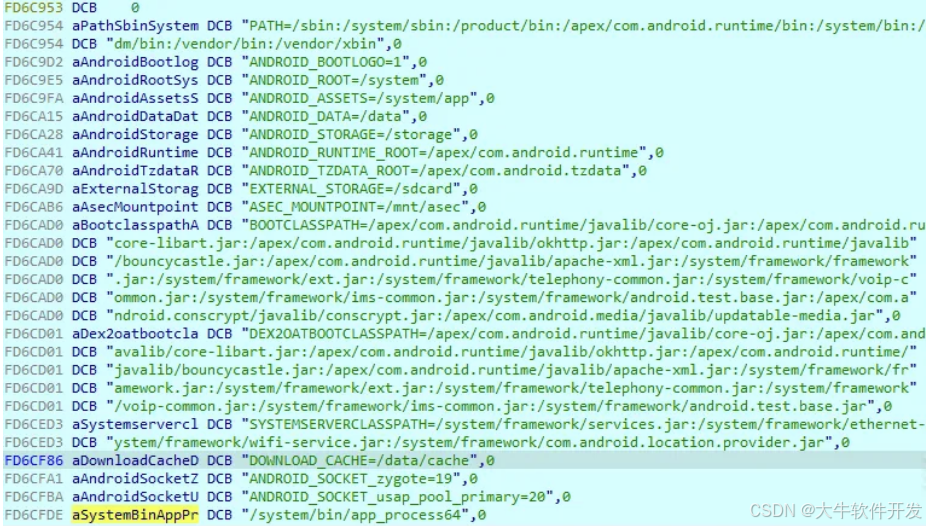
然後v1是否包含com.lbe.parallel,查了下這個APP,相關描述是"使用 Parallel Space 輕鬆地複製和運行同一應用程式的多個帳戶",大概是一個APP多開工具,看來這個工具也是不允許的。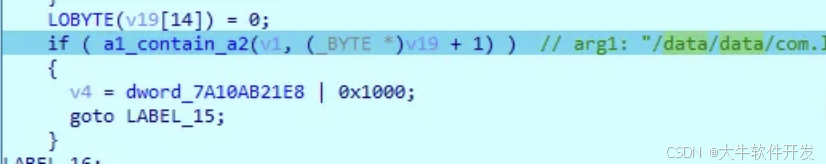
跳過中間的一些不太重要的邏輯,看到最後調用了幾個函數,逐一看看。

首先看check_blackdex,檢查了blackdex,這是一個著名的脫殼工具,被檢測到後會調用kill_func。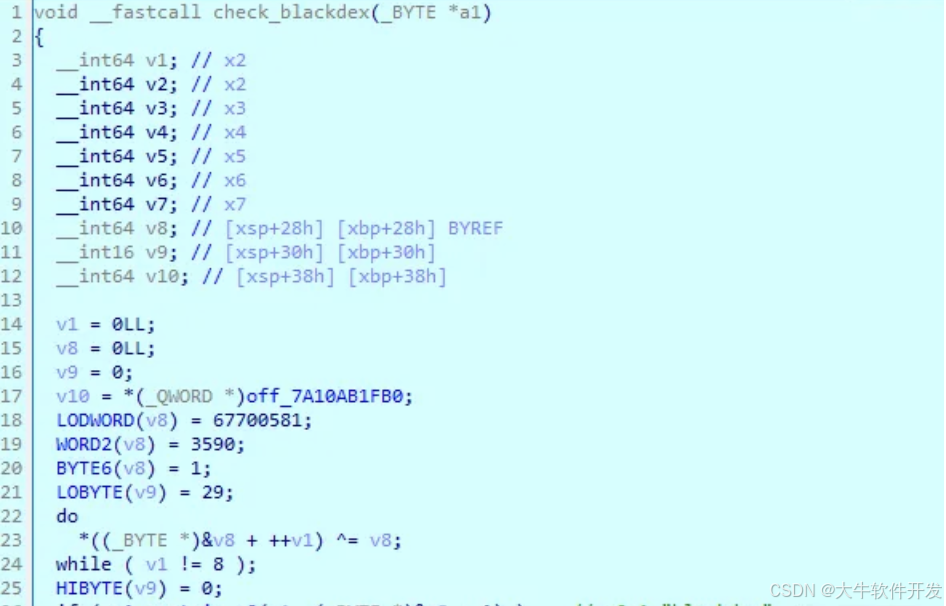
繼續看check_something,中間幾個5C85F0A264指向app_process64某處,不用理會。
重點是do_something1和do_something2。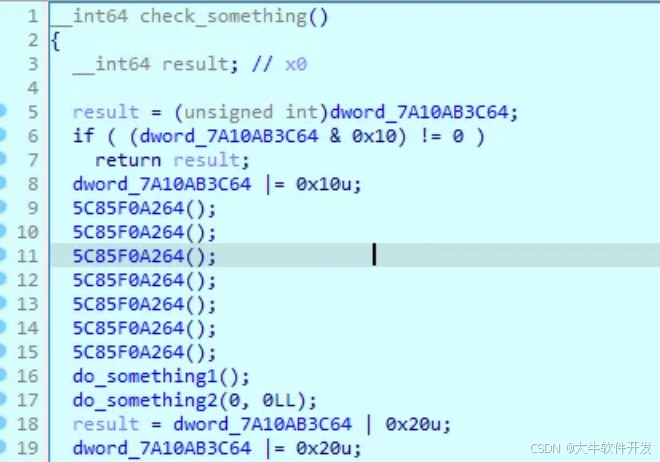
先看do_something1,一開始先打開了/proc/self/maps,算是比較經典的檢測點。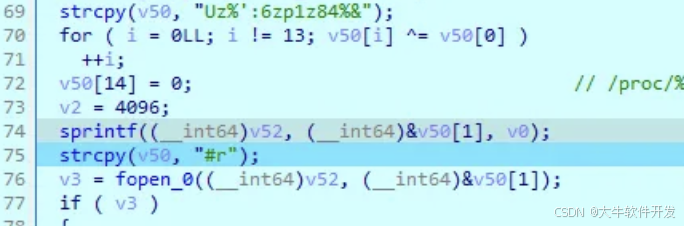
將從maps裡獲取的內容傳入check1函數。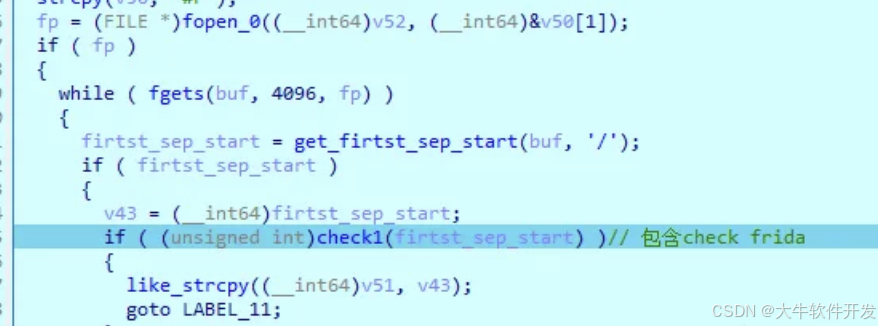
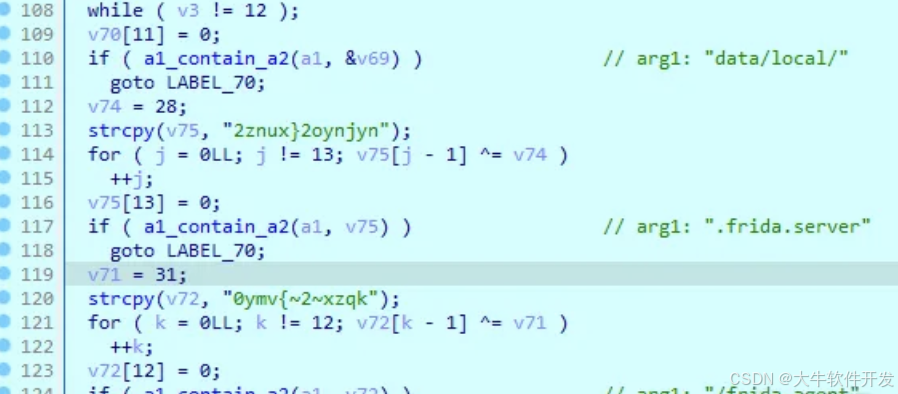
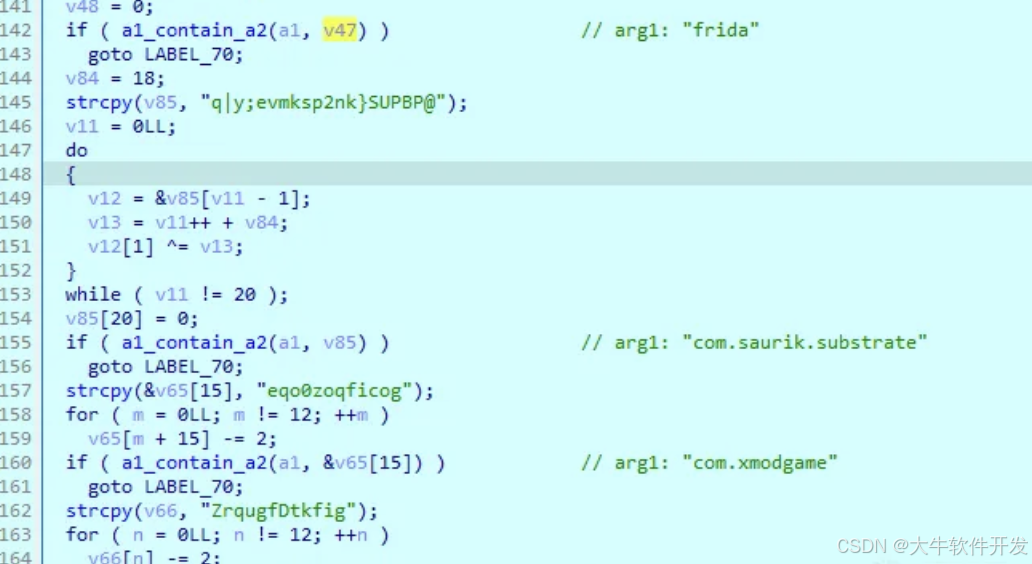
check1檢測的東西如下( 只顯示一部份 ),包括frida、xposed等等。由於我魔改的frida-agent.so放在了/data/local目錄下,因此被檢測出來了。
當maps中存在以下字符串時代表檢測到,會返回-1,反之返回0代表檢測不到。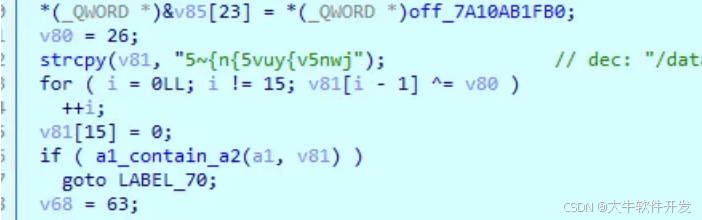
看完check1函數,回到do_something1繼續向下看,會發現另一層檢測邏輯。
首先通過scandir獲取/proc/<pid>/task下所有目錄。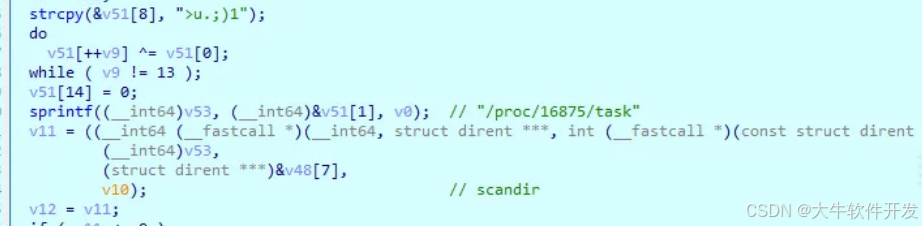
然後遍歷這些線程目錄,讀取/proc/<tid>/comm的內容。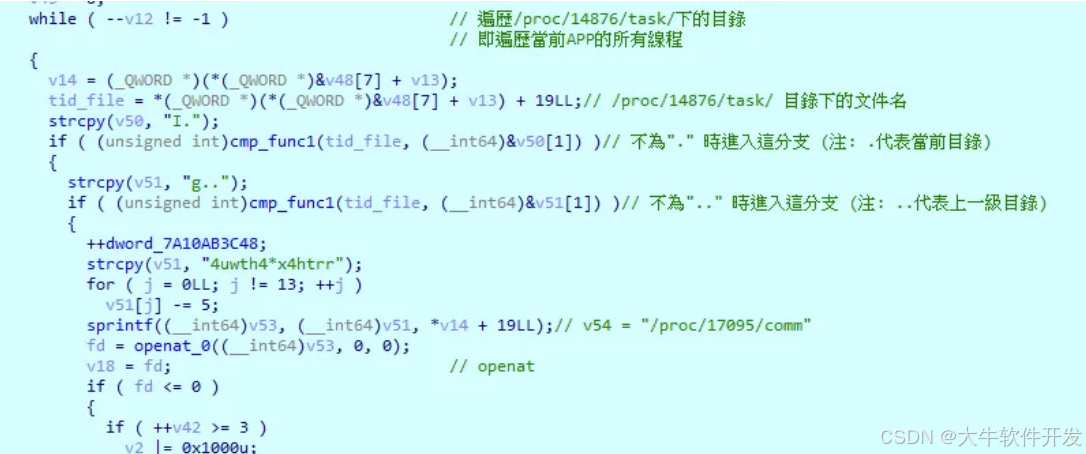
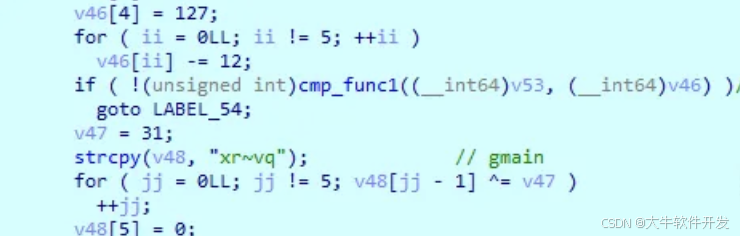
接著判斷/proc/<tid>/comm的內容是否與以下字符串相等,是則代表被檢測到。
可以看到pool-frida、gum-js-loop、gbus、gamin這些熟悉的frida特徵。
回到check_something函數,繼續看do_something2。
一開始先打開了/proc/<tid>/maps,然後調用check_maybe_io_redirect進行一些檢查,arg0是fopen返回的fp,arg1是"/proc/<tid>/maps"。
深入check_maybe_io_redirect看看具體做了什麼。
check_maybe_io_redirect中調用了check_fd。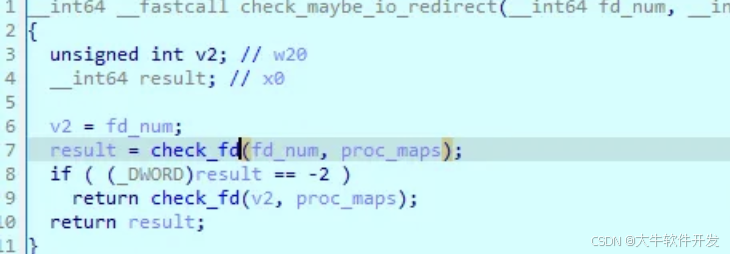
check_fd的檢測邏輯如下:
- 通過
sprintf構造一個諸如"/proc/16875/fd/38"的字符串,其中的38就是上述fopen的返回值。 - 調用
readlink將/proc/16875/fd/38符號鏈接的內容( 類似/proc/16875/maps)存儲到buf1中。 - 對比傳入的
proc_maps和buf1,正常來說它們要是相等的,都是/proc/<pid>/maps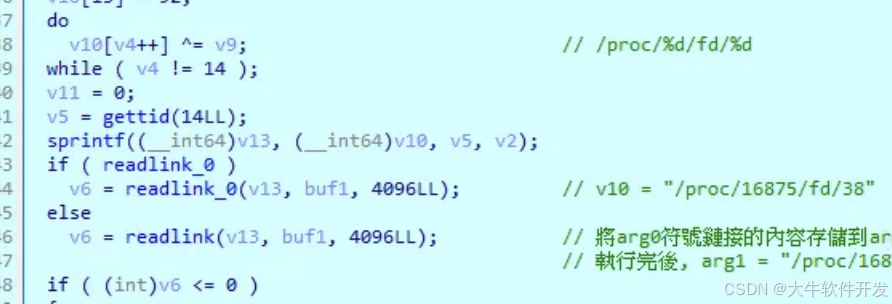
注:cmp_func1類似strcmp,相等才返回0。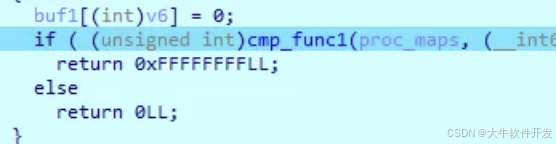
綜上分析,感覺大概是在檢測IO重定向?我沒有進一步測試,所以也不太確定。
回到do_something2函數繼續看,中間是一大段對proc_maps的判斷和操作,感覺不太重要。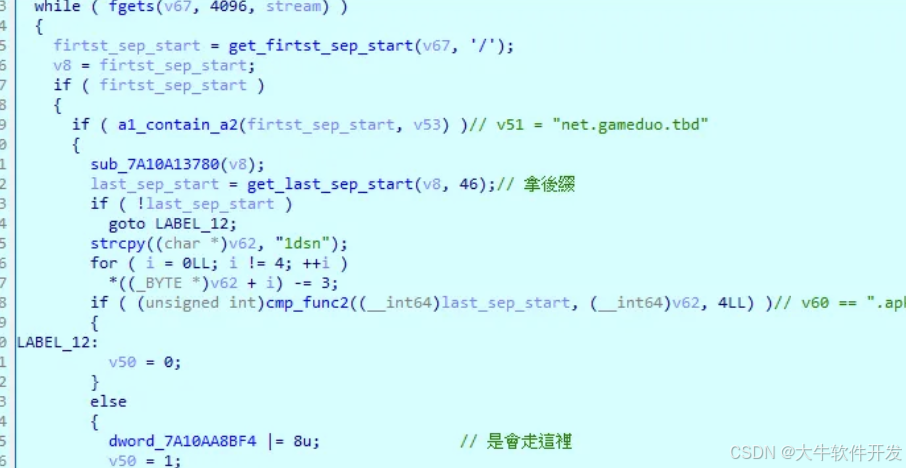
最後又調用了一次check_maybe_io_redirect,然後保存了base.apk的一些信息。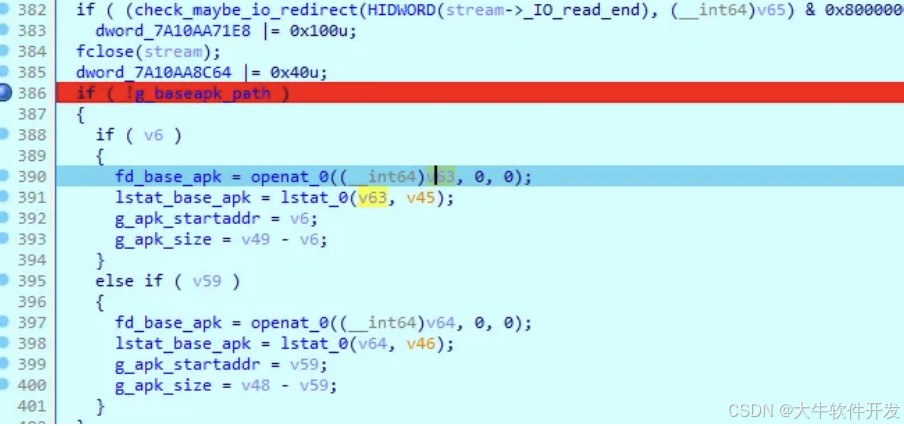
至此分析完init_array_func1的一些較為重要的函數。
init_array_func2
在靜態分析時只能看到有一個.init_array函數,實際上有2個,在執行完init_array_func1後單步慢慢走就能走到init_array_func2 ( 或者在linker打斷點也可以 )。
只調用了一個函數,直接進去看看。

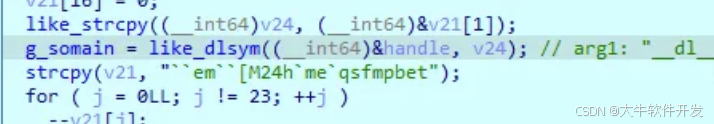
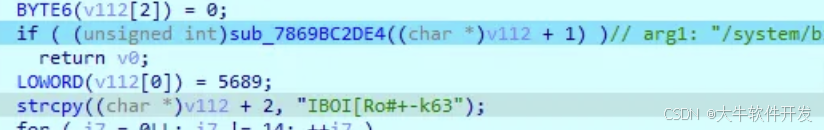
一開始是一段字符串解密邏輯,解密結果是/linker,然後調用like_strcpy賦給v24。
然後會調用like_dlopen,它會打開一個新的linker並進行一些初始化。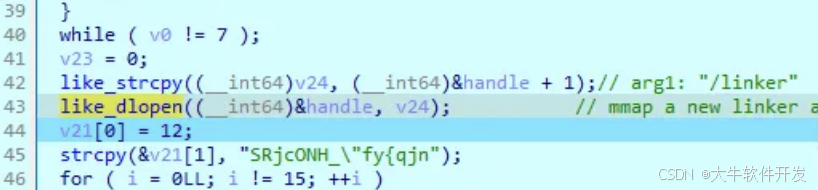
進入like_dlopen看看它是如何實現的。
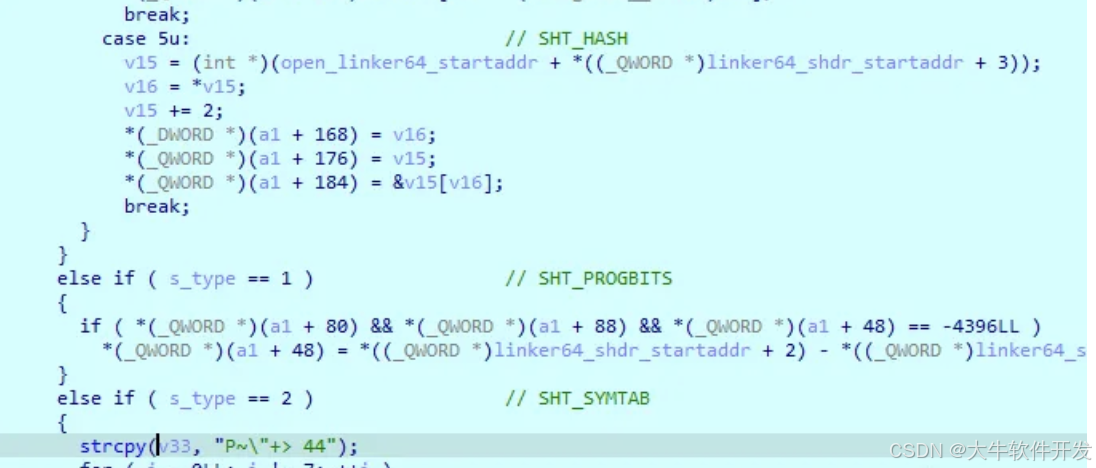
get_linker_startaddr中會獲取原linker的起始地址( 存放在*((_QWORD *)a1 + 3) ),然後調用openat + mmap將新的linker映射進內存。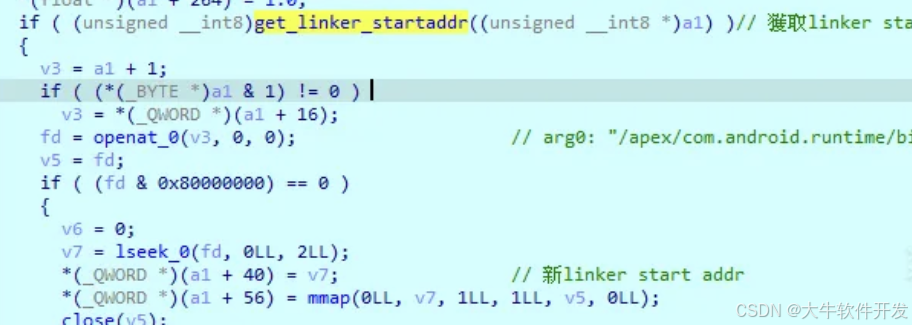
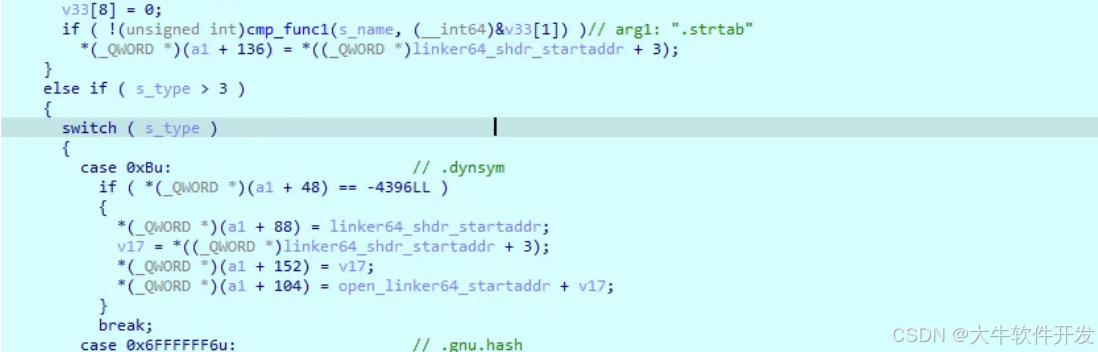
之後是一個while循環,通過與linker的原文件對比( 用010來進行字節對比 )發現,這是在遍歷setion header tables,並根據s_type進行一些初始化。所以結果都保存在a1 + x。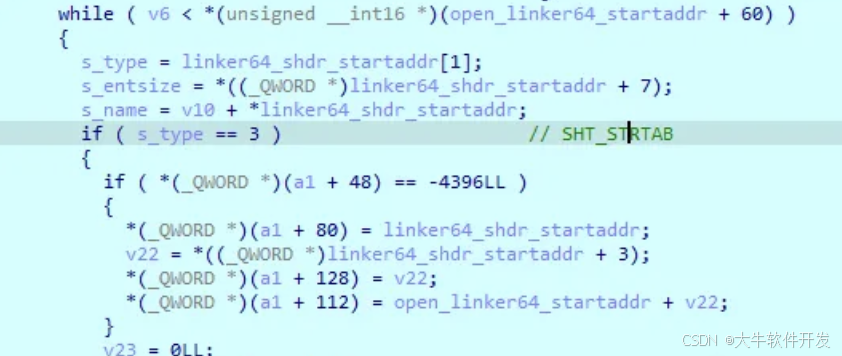
總的來說like_dlopen像是一個簡易版的dlopen。
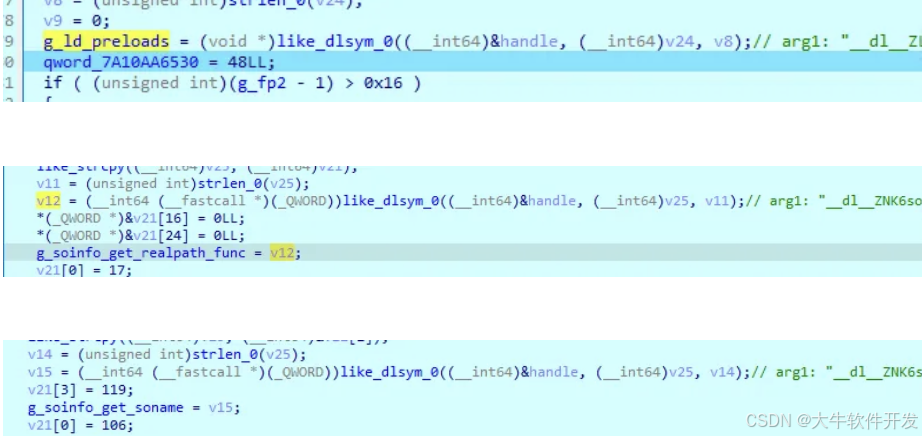
回到上一層,在like_dlopen後調用了數個like_dlsym獲取一些符號,並保存在不同的全局變量中。其中的g_solist、g_soinfo_get_realpath_func、g_soinfo_get_soname在之後的分析中會出現。
而具體like_dlsym的實現就不看了,是一堆很抽象的計算,反正從結果來看它類似dlsym。
最終調用一個函數清理一開始open + mmap映射進內存的那個linker,然後就返回了。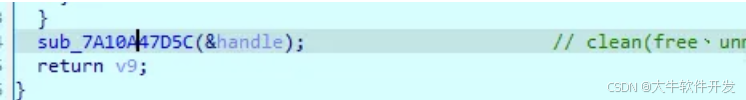
總的來說init_array_func2裡做了一堆與linker相關的操作,獲取了一些linker函數,大概會在之後的一些檢測點。
字符串函數
通過上述對.init_array函數的分析,可以發現一些經常出現與字符串有關的函數like_strcpy、a1_contain_a2、cmp_func1、cmp_func2等等。
其中的like_strcpy通常會在字符串解密邏輯執行後調用,可以算是最接近解密字符串的一個函數,因此嘗試hook like_strcpy看看。
在此之前先解決frida檢測的問題,從上述分析可以知道是如何檢測的,因此我一開始的想法是hook fgets抹寫/data/local特徵,同時fgets也是本例.init_array中執行時機較早的函數,因此可以以fgets為跳板去hook其他在.init_array時機執行的函數( 如like_strcpy )。
function addr_in_so(addr){
    var process_Obj_Module_Arr = Process.enumerateModules();
    for(var i = 0; i < process_Obj_Module_Arr.length; i++) {
        if(addr>process_Obj_Module_Arr[i].base && addr<process_Obj_Module_Arr[i].base.add(process_Obj_Module_Arr[i].size)){
            console.log(addr.toString(16),"is in",process_Obj_Module_Arr[i].name,"offset: 0x"+(addr-process_Obj_Module_Arr[i].base).toString(16));
        }
    }
}

let hooked = false;
function hook_fgets() {
    Interceptor.attach(Module.findExportByName(null, "fgets"), {
        onEnter: function(args) {
            this.res = args[0];
        },
        onLeave: function() {
            let res = this.res.readCString();
            // 1. bypass anti-frida
            if (res.indexOf("/data/local/ng1ok/ng1ok_server/ng1ok-64.so") != -1) {
                Memory.writeUtf8String(this.res, " ");
                if(!hooked) {
                    hooked = true;
                    // 2. hook .init_array
                    start_hook();
                }
            }
        }
    })
}

function start_hook() {

    function hook_like_strcpy(base) {
        let count = 0;
        Interceptor.attach(base.add(0xE384), {
            onEnter: function(args) {
                console.log("a1: ", args[1].readCString());
            }
        })
    }

    let base = Module.findBaseAddress("libdyzzwwc.so");
    console.log("base: ", base);
    hook_like_strcpy(base);
}

function main() {
    hook_fgets();
}

setImmediate(main);
結果是雖然frida不會再直接Process terminated,但依會彈窗提示,代表仍然有其他的frida檢測邏輯。
hook_like_strcpy打印了很多東西,只列出一些我看到且認為比較重要的:
// 1. 有點像完整性檢測
a1:  /libAdaptivePerformanceAndroid.so/libAdaptivePerformanceHint.so/libAdaptivePerformanceThermalHeadroom.so/libAndroidCpuUsage.so/libEncryptorP.so/libFirebaseCppAnalytics.so/libFirebaseCppApp-11_9_0.so/lib_burst_generated.so/libapminsighta.so/libapminsightb.so/libapplovin-native-crash-reporter.so/libbuffer_pg.so/libdyzzwwc.so/libfile_lock_pg.so/libil2cpp.so/libmain.so/libnative-googlesignin.so/libnms.so/libtobEmbedPagEncrypt.so/libunity.so
a1:  .
a1:  .
a1:  null:0:0:0:29256:0:d7db4753:5.1.1.139:null:10:10
a1:  null
a1:  5.1.1.139
a1:  d7db4753

// 2. root
a1:  /system/xbin/su
a1:  /system/bin/su
a1:  /sbin/su
a1:  /cache/su
a1:  /data/local/bin/su
a1:  /data/local/su
a1:  /data/local/xbin/su
a1:  /data/su
a1:  /system/bin/su
a1:  /system/xbin/bstk/su

// 3. magisk
a1:  /system/bin/magisk
a1:  /system/bin/magiskinit
a1:  /system/bin/magiskpolicy

// 4. android屬性?
a1:  /dev/__properties__/property_info

// 5. maybe frida?
a1:  ng1ok-64.so
a1:  FF130916
a1:  /proc/self/net/unix
a1:  7c3551fe3618

// 6. others
a1:  USB Connected
a1:  Alertdialog
a1:  debuggable
另一處anti-frida
注:其實只要hook check1讓其固定返回0就能完全bypass,但由於我比較好奇另一個frida檢測的實現邏輯,因此才進行了接下來的操作。
同上面那樣hook like_strcpy,在遇到"ng1ok-64.so"時打印調用棧。
function hook_like_strcpy(base) {
    let count = 0;
    Interceptor.attach(base.add(0xE384), {
        onEnter: function(args) {
            if(args[1].readCString().indexOf("ng1ok-64.so") != -1) {
                console.log("a1: ", args[1].readCString());
                Thread.backtrace(this.context, Backtracer.FUZZY).map(addr_in_so);
            }
        }
    })
}
打印調用棧如下:
| 1 2 3 4 5 6 7 8 9 10 11 12 13 14 15 16 17 18 19 20 21 22 23 24 25 26 27 28 29 30 31 32 33 34 35 36 37 38 39 40 41 42 43 44 45 46 47 48 49 50 51 52 53 |
|
可以看到有一堆不同的地方,一開始還以為有那麼多不同的frida檢測邏輯,打算一個一個替換看看。
function hook_like_strcpy(base) {
    let count = 0;
    Interceptor.attach(base.add(0xE384), {
        onEnter: function(args) {
            if(args[1].readCString().indexOf("ng1ok-64.so") != -1) {
                if(count++ == 0) {
                    Memory.writeUtf8String(args[1], "tteesstt");
                }
                console.log("a1: ", args[1].readCString());
                Thread.backtrace(this.context, Backtracer.FUZZY).map(addr_in_so);
            }
        }
    })
}
誰知道在替換第一個後,就只剩一個調用棧了。
而且APP顯示的檢測點也從ng1ok-64.so變成debuggable。
a1:  tteesstt
7a0ee2c20c is in libdyzzwwc.so offset: 0x1720c
7a0ee38864 is in libdyzzwwc.so offset: 0x23864
7a7bbd1974 is in libart.so offset: 0x5ab974
7a211ff25c is in ng1ok-64.so (deleted) offset: 0x8e925c
7a211ff25c is in ng1ok-64.so (deleted) offset: 0x8e925c
7a2120830c is in ng1ok-64.so (deleted) offset: 0x8f230c
7a0ee39624 is in libdyzzwwc.so offset: 0x24624
7a2120851c is in ng1ok-64.so (deleted) offset: 0x8f251c
7a0ee3919c is in libdyzzwwc.so offset: 0x2419c
7a0ee3919c is in libdyzzwwc.so offset: 0x2419c
7afe1af0a4 is in libdl.so offset: 0x10a4
7a0ee390e0 is in libdyzzwwc.so offset: 0x240e0
7a0ee67310 is in libdyzzwwc.so offset: 0x52310
7a7b766354 is in libart.so offset: 0x140354
看到上述調用棧libdyzzwwc.so offset: 0x240e0調用了libdl.so offset: 0x10a4,動調看看。
發現調用了dl_iterate_phdr,這個函數的作用大概是會遍歷所依賴的共享庫,對每個對象都調用一次回調。
要單步F7才能慢慢跟到callback_func裡面。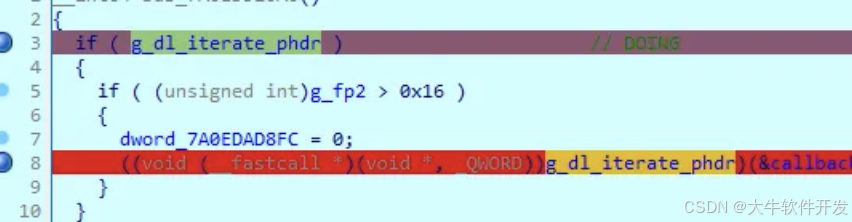
然後會跟到linker64的dl__Z18do_dl_iterate_phdrPFiP12dl_phdr_infomPvES1,在這裡調用上述的callback_func。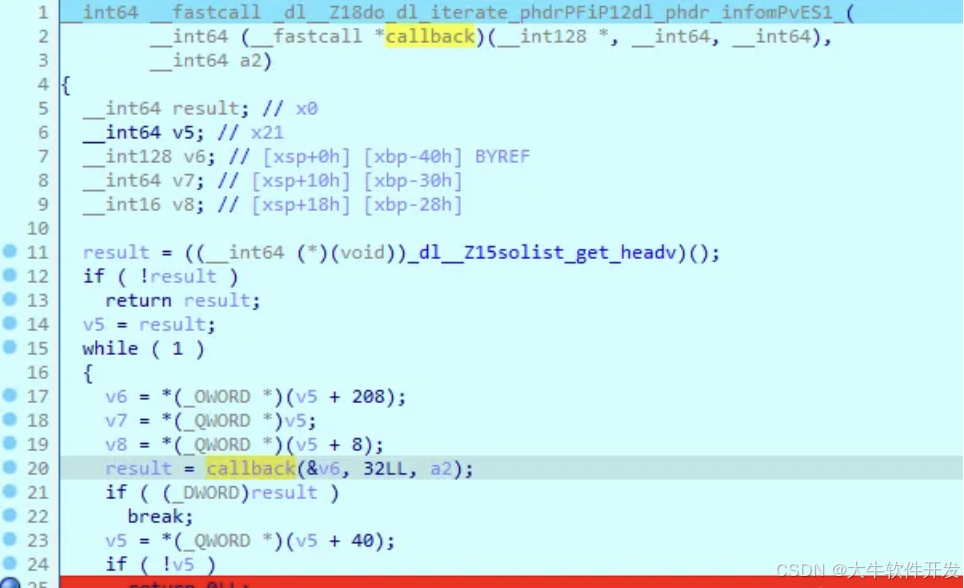
跟入callback_func,不知為何F5的結果與匯編的結果不一致( 大概是IDA對某些函數錯誤的分析所導致的連鎖效應 ),只能從匯編視圖繼續跟。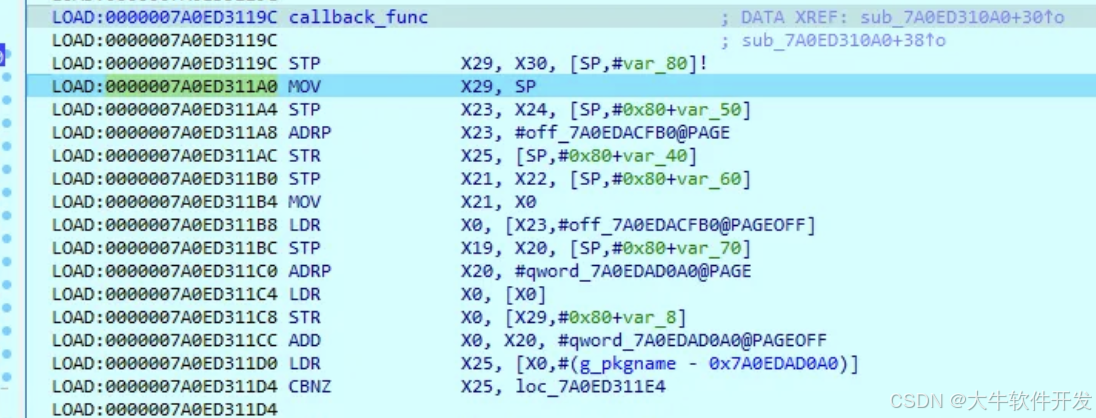
x0為"/system/bin/linker64",x1為libdl.so,cmp_func1類似strcmp,相等才會返回0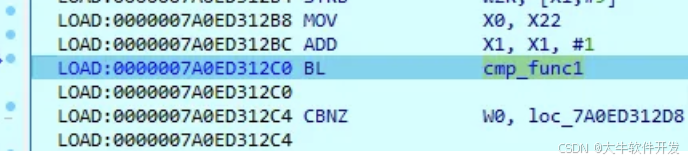
x0為"/system/bin/linker64",x1為/data/app,cmp_func2同樣類似strcmp。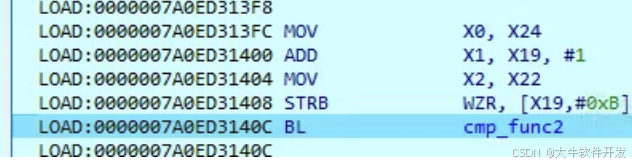
x0為"/system/bin/linker64",x1為packagename,x0包含x1時才為true,否則會走到check_smaps函數。
跟了一會可以總結出,x0就是dl_iterate_phdr遍歷時傳給callback_func的共享庫名字。
callback_func的大概邏輯就是將除了libdl.so、以/data/app/開頭、包含packagename的so都過濾後,然後調用check_smaps檢查。

而check_smaps會調用check1。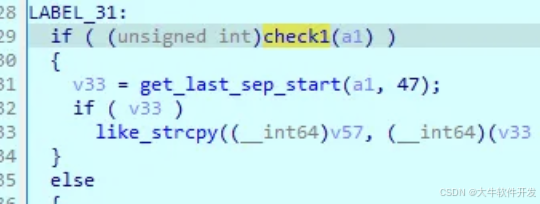
再來回顧下check1,裡面有一段這樣的檢測,而由於我魔改的frida-agent-<arch>.so放在了/data/local目錄下,所以才會被檢測到。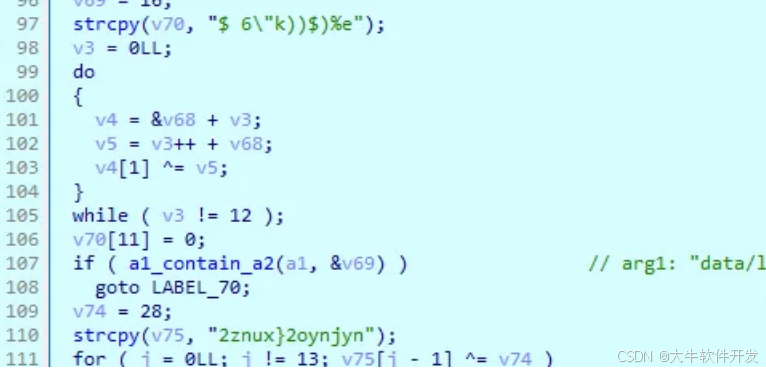
試下直接將check1固定返回0,看看可否bypass。
function hook_check1(base) {
    // 1643C
    Interceptor.attach(base.add(0x1643C), {
        onEnter: function(args) {
        },
        onLeave: function(retval) {
            if(retval.toInt32() != 0) {
                console.log(`bypass check1 (before retval: ${retval})`)
                retval.replace(0);

            }
        }
    })
}
成功,不再顯示ng1ok-64.so,而是顯示debuggable。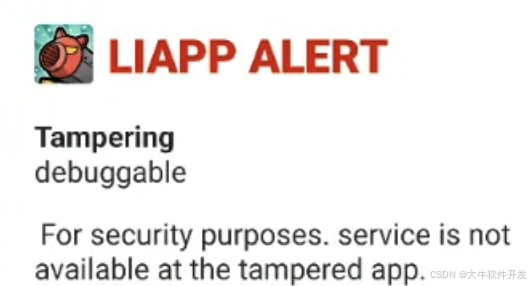
小結:
除了fopen("/proc/<pid>/maps") + fgets這套組合技外,還可以通過dl_iterate_phdr來實現類似遍歷/proc/<pid>/maps的效果,因此我一開始hook fgets時才無法bypass。
debuggable檢測
會觸發這個檢測是大概是因為我的手機環境是自定制的AOSP,我設置了所有APP默認有debuggable權限。
為了驗證是否如我所想,我將APP debuggable權限改成了可切換的模式。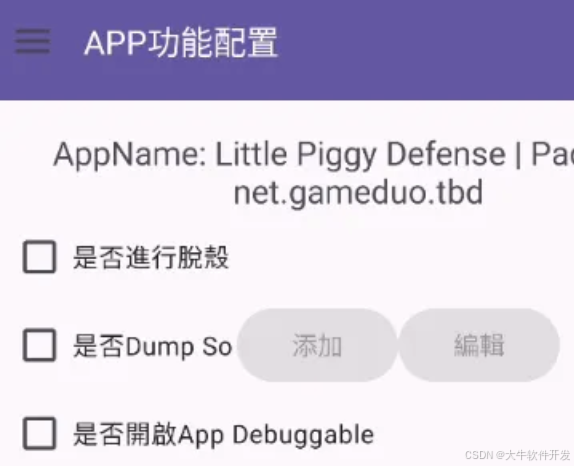
可以看到,關閉debuggable的狀態下是可以正常進入遊戲的。
但關了debuggable權限後就無法動調了,這很不好。嘗試過找具體的檢測代碼,想針對性地bypass,但沒找到。
最終的解決方案是patch掉導致APP閃退的函數來bypass,後文會說明是哪個函數。
.init_array之外的檢測函數
在動調.init_array函數的過程中,會對其中用到的一些函數下斷點。
某次調試完.init_array後按F9繼續運行,發現斷在了某個地方,向上回溯能來到另一個超大的檢測函數,我將其命名為after_initarray_check2。
一開始沒有細究after_initarray_check2是誰調用的,後來想了想明顯是Java層調用的native函數。
將APP拉入jadx,查找dyzzwwc。

其中只有一個native函數,顯然就是它。
同時會發現Java層做了一些混淆,但目前並不需要分析Java層,因此也無所謂了。

之後各種檢測的上層調用棧都是after_initarray_check2,因此這裡先小小分析一下它的來源。
N個線程檢測函數
在動調after_initarray_check2時,會發現IDA越來越卡,而且經常亂跳,經常crash,經常卡住不動。
一開始還以為是IDA的老問題( IDA動調有時候是真的卡… ),但漸漸感到不太對,直到在某處看到pthread_create才恍然大悟,猜測大概是after_initarray_check2啟動了一堆線程。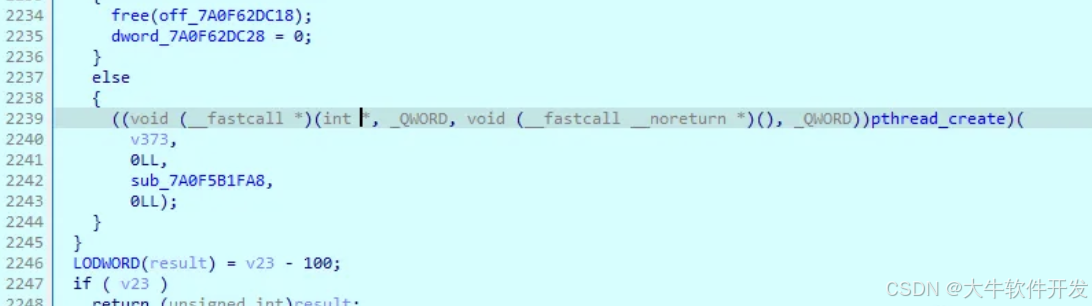
hook了pthread_create後發現果然如此,創建了N個線程,數了下總共有11個不同的線程回調函數。
後面會繼續分析這些線程到底在檢測什麼,現在先嘗試bypass,目的是讓frida可以正常hook APP( 並且解決debuggable檢測 )而不閃退。
| 1 2 3 4 5 6 7 8 9 10 11 12 13 14 15 16 17 18 19 20 21 22 23 24 25 26 27 28 29 30 31 32 33 34 35 36 37 38 39 40 41 42 43 44 45 46 |
|
bypass all
APP啟動了那麼多的線程,相關的檢測邏輯大概都在其中,因此嘗試直接patch掉所有線程。
結果是APP雖然不會再彈出Alert Dialog,但會在進度條加載到某個時刻時閃退。
嘗試hook動調時發現的kill_func,看看會否觸發,順便打印調用棧。
function hook_exit(base) {
    // 0x10CFC
    Interceptor.attach(base.add(0x10CFC), {
        onEnter: function() {
            console.log("call kill func");
            Thread.backtrace(this.context, Backtracer.FUZZY).map(addr_in_so);
        }
    })
}
的確會觸發,跳到對應位置繼續分析
| 1 2 3 4 5 6 7 8 9 10 11 12 13 14 15 16 17 |
|
發現是pthread_func9( 我命名的第9個檢測線程 )創建失敗所導致。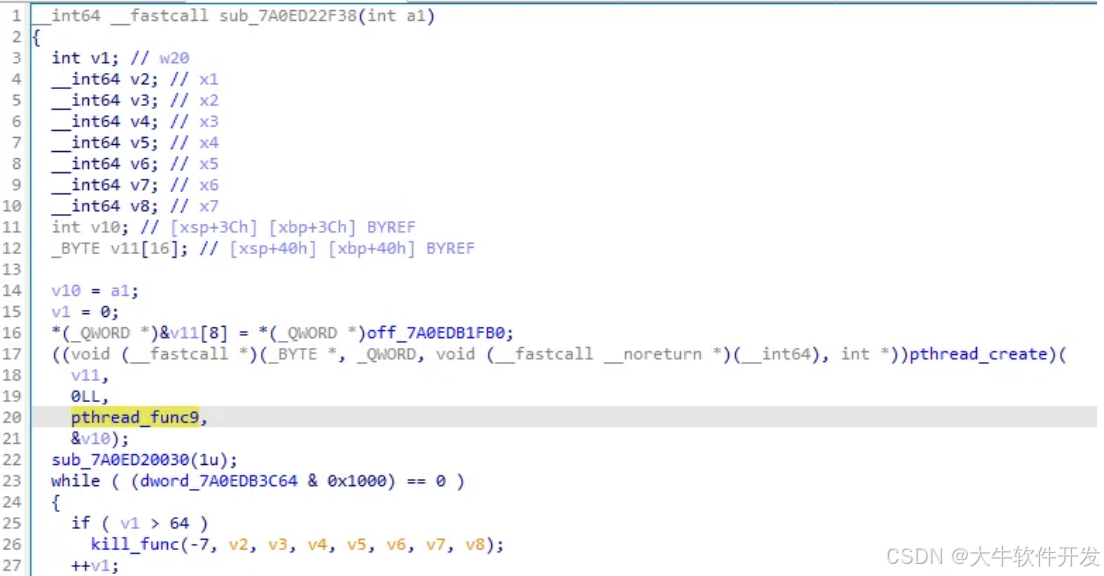
嘗試讓pthread_func9順利創建
// 在hook pthread_create中放行pthread_func9
if(offset == 0x112E4) { // 0x112E4: offset of pthread_func9
    console.log("pass pthread_func9");
    return pthread_create(parg0, parg1, parg2, parg3)
}
之後雖然能順利進入遊戲,但過一陣子同樣閃退。
call kill func
7a0dc142dc is in libdyzzwwc.so offset: 0x112dc
7a0dc14368 is in libdyzzwwc.so offset: 0x11368
7afcf12730 is in libc.so offset: 0xe3730
7afceb3008 is in libc.so offset: 0x84008
由此可知各個檢測線程存在一定程度上的耦合,牽一髮則動全身。
最終的通用bypass手段是從kill_func入手( 猜測所有閃退都會調用kill_func ),嘗試直接patch掉kill_func,讓它固定返回0,成功讓APP與frida都不再閃退。
function patch_exit(base) {
    // 0x10CFC
    Interceptor.replace(base.add(0x10CFC), new NativeCallback(() => {
        console.log("call kill func");
        return 0;
    }, "int", []))
}
至此我遇到的2個反調試都已成功繞過,但我同樣比較好奇其他檢測線程干了什麼,因此下文會繼續分析看看其他線程( 不會全部線程都分析 )。
調試線程前置
-
通過frida + IDA來動調( 而不是
adb shell am start -D -n XXX那種方式 ),這樣做的目的是:- 可以選擇只讓哪個線程被成功創建,然後就可以單獨分析該線程。
- 需要frida hook
kill_func來防止閃退。
function hook_pthread() { var pthread_create_addr = Module.findExportByName(null, 'pthread_create'); console.log("pthread_create_addr,", pthread_create_addr); var pthread_create = new NativeFunction(pthread_create_addr, "int", ["pointer", "pointer", "pointer", "pointer"]); Interceptor.replace(pthread_create_addr, new NativeCallback(function (parg0, parg1, parg2, parg3) { var so_name = Process.findModuleByAddress(parg2).name; var so_path = Process.findModuleByAddress(parg2).path; var so_base = Module.getBaseAddress(so_name); var offset = parg2 - so_base; // if(so_name.indexOf("libdyzzwwc.so") != -1) // console.log("so_name", so_name, "offset", ptr(offset), "path", so_path, "parg2", parg2); var PC = 0; if ((so_name.indexOf("libdyzzwwc.so") > -1)) { // console.log("find thread func offset", so_name, offset); // if(offset == 0x112E4) { // maybe the Alert Dialog // console.log("ignore to patch: pthread_func9"); // return pthread_create(parg0, parg1, parg2, parg3) // } // if(offset == 0x332A4) { // console.log("ignore to patch: pthread_func8_check_app_debuggable"); // return pthread_create(parg0, parg1, parg2, parg3) // } // if(offset == 0x2D4C4) { // nothing // console.log("ignore to patch: pthread_func1"); // return pthread_create(parg0, parg1, parg2, parg3) // } // if(offset == 0x112A0) { // nothing // console.log("ignore to patch: pthread_func2"); // return pthread_create(parg0, parg1, parg2, parg3) // } // if(offset == 0x25FA8) { // nothing // console.log("ignore to patch: pthread_func3"); // return pthread_create(parg0, parg1, parg2, parg3) // } // if(offset == 0x44834) { // nothing // console.log("ignore to patch: pthread_func4"); // return pthread_create(parg0, parg1, parg2, parg3) // } // if(offset == 0x15F30) { // nothing // console.log("ignore to patch: pthread_func5"); // return pthread_create(parg0, parg1, parg2, parg3) // } // if(offset == 0x45A68) { // detect: net.gameduo.tbd.apk // console.log("ignore to patch: pthread_func6"); // return pthread_create(parg0, parg1, parg2, parg3) // } // if(offset == 0xF2D0) { // nothing // console.log("ignore to patch: pthread_func7"); // return pthread_create(parg0, parg1, parg2, parg3) // } // if(offset == 0x39E18) { // shamiko?? // // 前置: pthread_func6、pthread_func7、pthread_func9 // console.log("ignore to patch: pthread_func10"); // return pthread_create(parg0, parg1, parg2, parg3) // } if(offset == 0x2466C) { // nothing console.log("ignore to patch: pthread_func11"); return pthread_create(parg0, parg1, parg2, parg3) } } else { PC = pthread_create(parg0, parg1, parg2, parg3); // console.log("ordinary sequence", PC) } return PC; }, "int", ["pointer", "pointer", "pointer", "pointer"])) } -
patch
nanosleep,對本例來說,它會導致動調時卡住不動,大概也是由某個反調試邏輯觸發的,直接讓其固定返回0就可以。function hook_nanosleep() { Interceptor.replace(Module.findExportByName(null, "nanosleep"), new NativeCallback(() => { return 0; }, "int", ["pointer", "pointer"])) } -
最好是在對應的
pthread_create和對應的線程回調函數裡都下斷點,只在線程的回調函數裡下斷點可能會失敗。
-
斷在對應的
pthread_create後,最好先暫時其他線程,這樣會比較好調,防止其他線程的干擾。IDA Python腳本:一鍵暫停其他線程1
2
3
4
5
6
7
8
9
importidc;defsuspend_other_thread():current_thread=idc.get_current_thread()thread_count=idc.get_thread_qty()foriinrange(0, thread_count):other_thread=idc.getn_thread(i)ifother_thread !=current_thread:idc.suspend_thread(other_thread)suspend_other_thread()
pthread_func6
function offset:0x45A68
pthread_func6一開始先調用check_fingerprint3函數進行第一部份的檢測,進入看看。

check_fingerprint3裡調用check_su檢查了一些常規的su路徑。
check_su會先構造各種可能的su路徑,如/system/xbin/su,然後傳入check_su_path_exist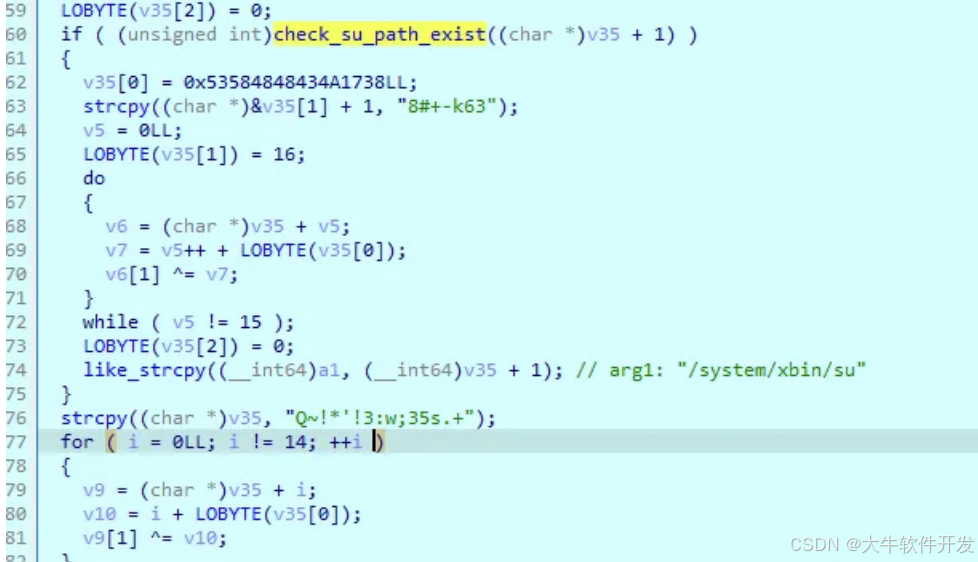
check_su_path_exist( 其實叫做check_path_exist會好點,因為這個函數不只用來檢測su路徑 )會創建pthread_func7來檢測。
pthread_func7具體實現下一小節再看。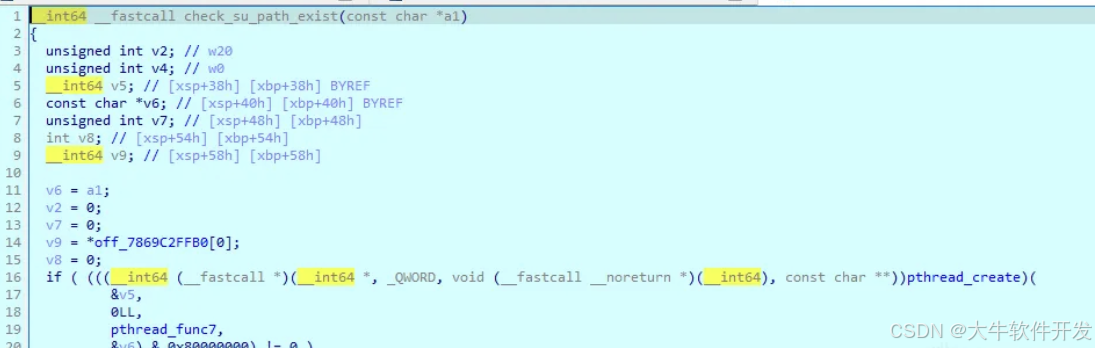
回到check_fingerprint3繼續向下看。
檢查ro.build.fingerprint是否包含userdebug。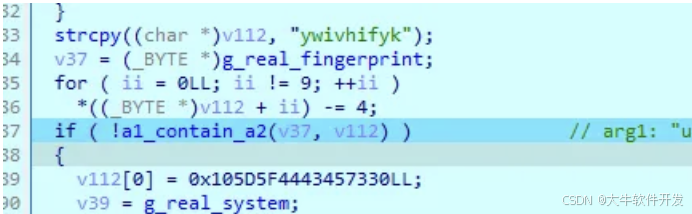
比較ro.product.model與Custom Phone是否相同。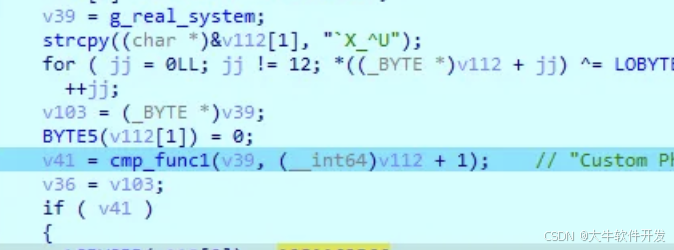
檢查magisk特徵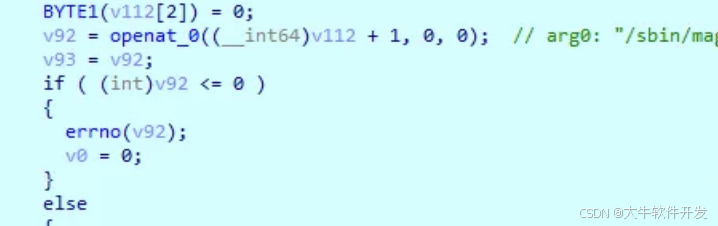
獲取環境變量,遍歷其中的所有路徑,傳入trav_dir_and_check_su函數。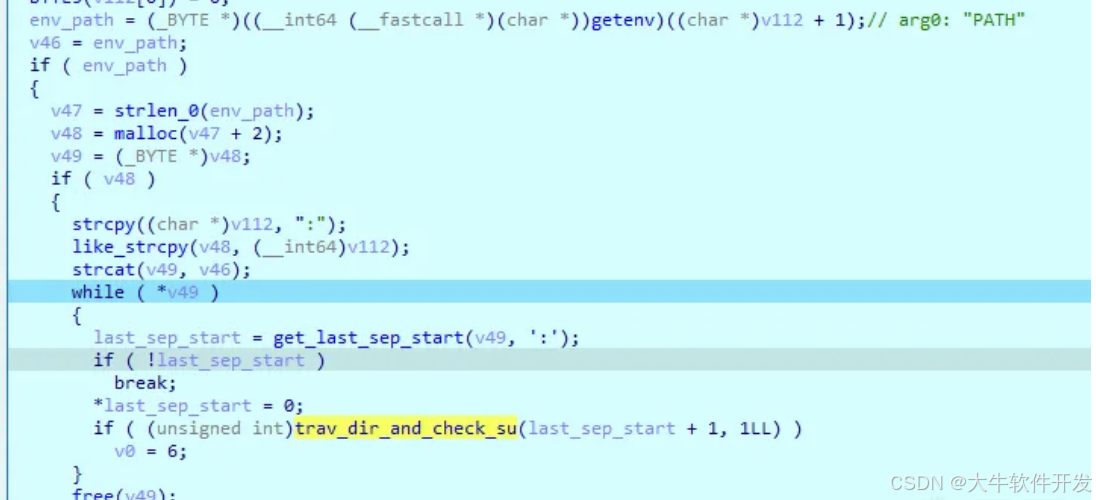
注:trav_dir_and_check_su函數實現如下,通過scandir來遍歷指定目錄,然後檢查其中是否包含su文件。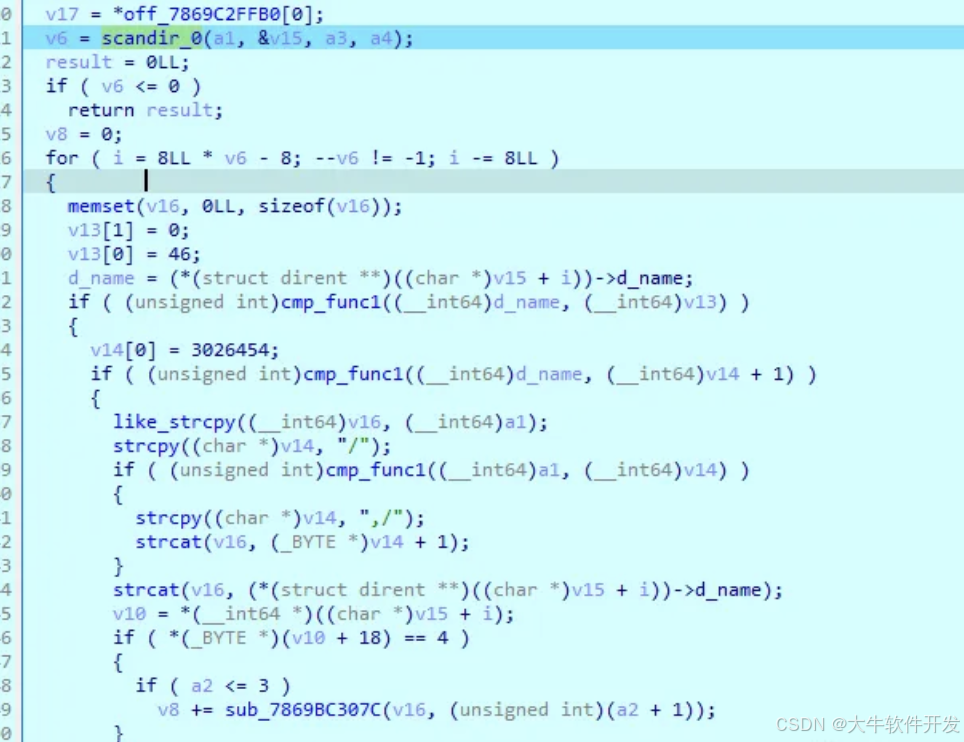
連/sdcard/Download/boot.img都不放過?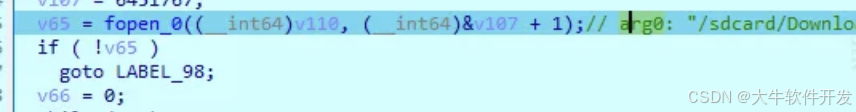
又是一些magisk特徵:
/system/bin/magisk、/system/bin/magiskinit、/system/bin/magiskpolicy、/system/bin/resetprop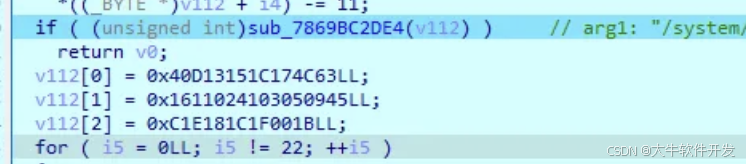
最後又有一些su檢測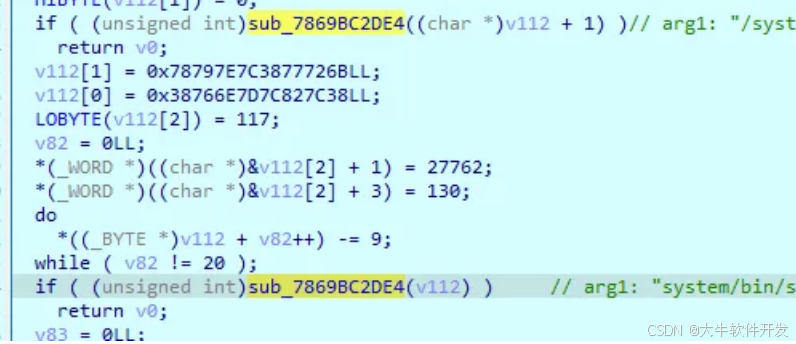
看完check_fingerprint3後,回到pthread_func6繼續向下看( 只發現一處特別可疑的地方 )。
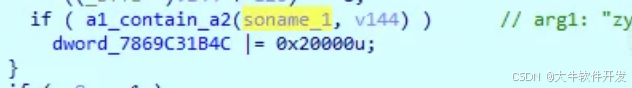
循環遍歷solist ( 由g_solist賦值 ),調用soinfo_get_realpath ( 實際調用的是g_soinfo_get_realpath_func )、soinfo_get_soname ( 實際調用的是g_soinfo_get_soname )來獲取realpath和soname,然後判斷其中是否包含zygisk的特徵。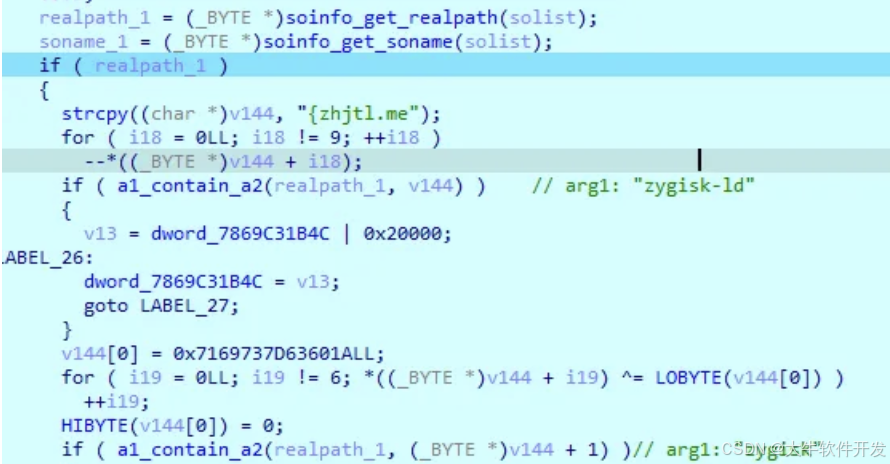
小結:
pthread_func6總的來說就是一個root檢測。
pthread_func7
function offset:0xF2D0
pthread_func7中會通過各種手段嘗試打開/訪問傳入來的路徑,如果能順利執行就代表被檢測到。
用到的API包括:fopen、openat、scandir、lstat、stat、access、readlink。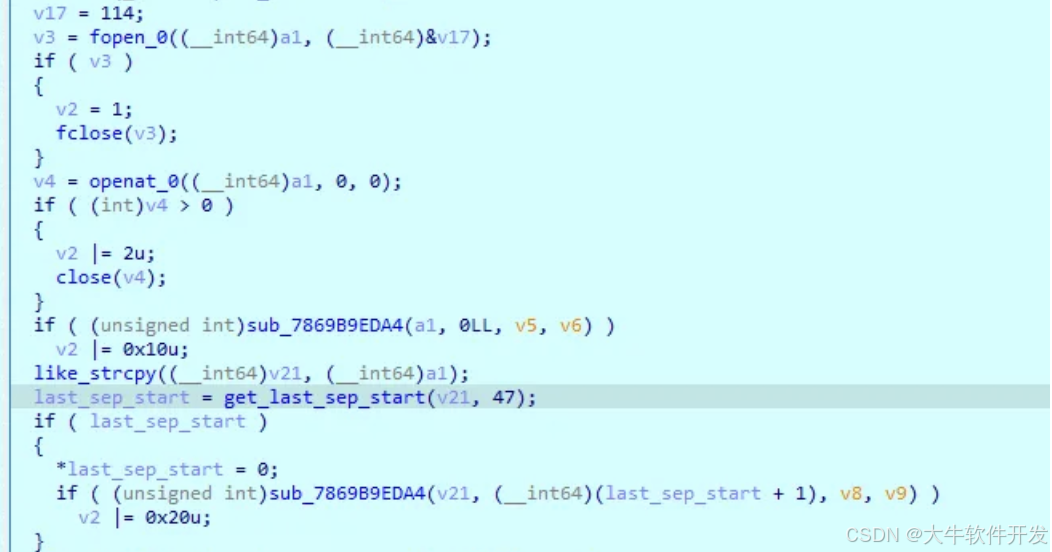

pthread_func10
function offset:0x39E18
一開始調用了sub_7869BC4880,動調時沒有看出它在干什麼。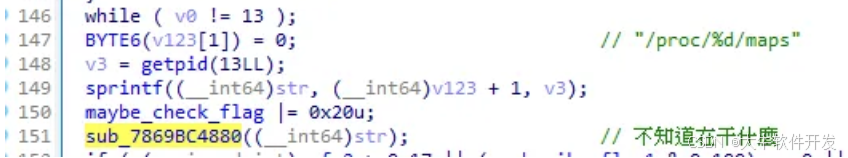
但在靜態分析時手動解密了sub_7869BC4880中的一些字符串,大概是一些模擬器的特徵檢測。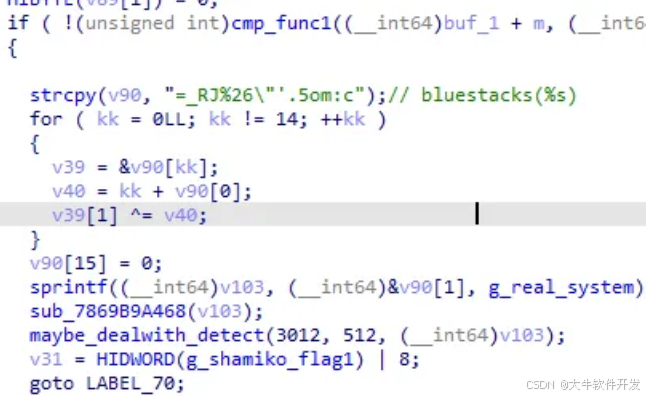
回到pthread_func10繼續向下看。
調用了check_BlueStacks_emu,它專門檢測了BlueStacks模擬器。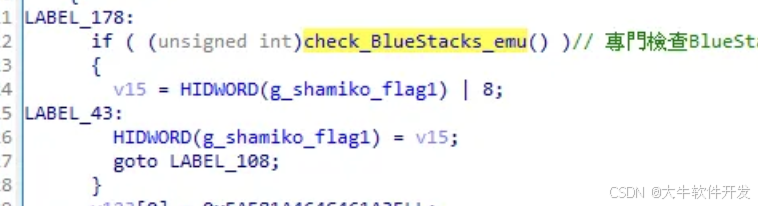
具體檢測了以下特徵:( 將以下字符串作為參數傳入check_su_path_exist )
| 1 2 3 4 5 6 7 8 9 10 11 |
|
繼續向下看,又檢測了一些特徵,不認識。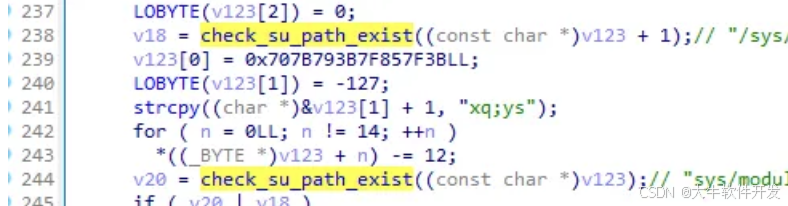
檢測夜神模擬器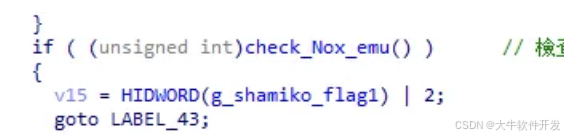
具體檢測了以下特徵:
| 1 2 |
|
檢測雷電模擬器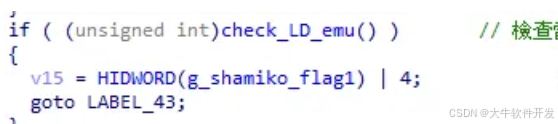
具體檢測了以下特徵:
| 1 |
|
檢測KoPlayer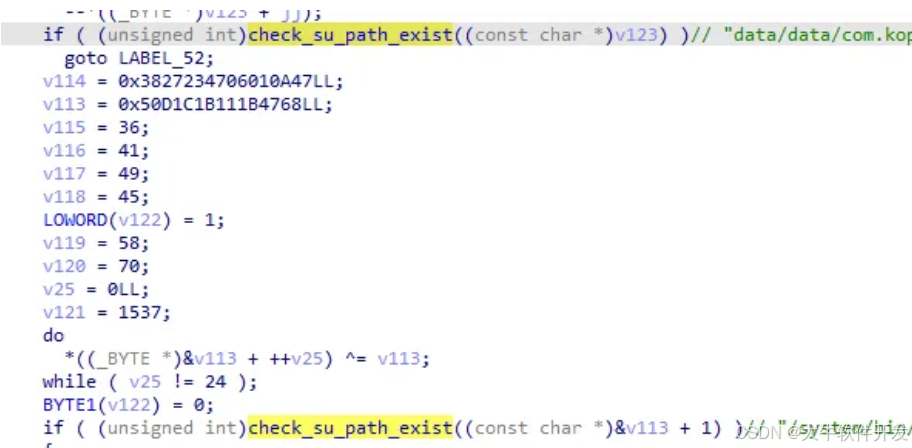
檢測一些虛擬機特徵:
| 1 2 3 4 5 6 |
|
檢測Android指紋中是否包含:
| 1 2 3 4 5 |
|
調用check_android_prop檢測了一些android屬性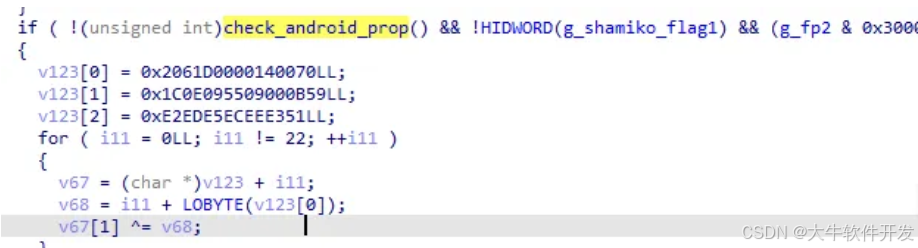
具體獲取了以下android屬性:
| 1 2 3 4 5 6 7 8 9 10 |
|
小結:
pthread_func10總的來說就是一個模擬器/虛擬機檢測,除此之外大概還檢測了shamiko,但我動調時走不到相應的檢測邏輯,故沒有分析其具體實現。
il2cpp dump
繞過相關反調試後,終於可以開始我們的「正文」了,沒想到這部份是最簡單的…
這個手遊是經典的Unity + il2cpp,它的libil2cpp.so沒有加密,但global-metadata.dat明顯加密了。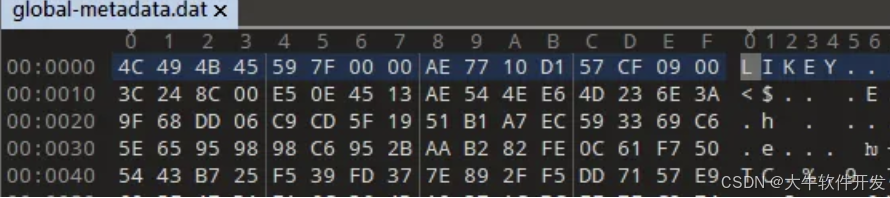
在libil2cpp.so搜"global-metadata.dat"定位到其加載函數sub_A6D2B0。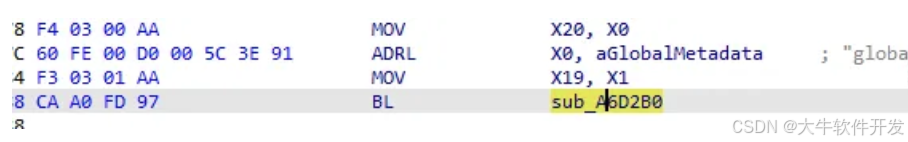
frida dump腳本:
function dump_bin(name, addr, size) {
    var file_path = "/data/data/net.gameduo.tbd" + "/" + name + ".bin";
    console.log("dump path: ", file_path);
    var file_handle = new File(file_path, "wb");
    if (file_handle && file_handle != null) {
        Memory.protect(ptr(addr), size, 'rwx');
        var libso_buffer = ptr(addr).readByteArray(size);
        file_handle.write(libso_buffer);
        file_handle.flush();
        file_handle.close();
        console.log("[dump]:", file_path);
    }
}
function get_size(addr) {
    const metadataHeader = addr;
    let fileOffset = 0x10C;
    let lastCount = 0;
    let lastOffset = 0;
    while (true) {
        lastCount = Memory.readInt(ptr(metadataHeader).add(fileOffset));
        if (lastCount !== 0) {
            lastOffset = Memory.readInt(ptr(metadataHeader).add(fileOffset-4));
            console.log("fileOffset : ", ptr(fileOffset))
            break;
        }
        fileOffset -= 8;
        if(fileOffset <= 0)
        {
            console.log("get size failed!");
            break;
        }
    }
    return lastOffset + lastCount;
}
function dump_gm(base) {
    Interceptor.attach(base.add(0xA6D2B0),{
        onEnter(args){
            console.log("[libil2cpp] arg0: ", args[0].readCString());
        },
        onLeave(retval){
            dump_bin("global-meta", retval, get_size(retval));
        }
    })
}
dump下來的global-metadata可以直接用在Il2cppDumper。
最後,隨便找了個函數來hook,成功修改了升級所需的經驗。
結語
淺淺過了一遍LIAPP這個保護,能看出來它花了大量功夫在反調試上,與常規防護不同的是它沒有一個固定的字符串解密函數,導致逆向時無法一步到位發現所有可疑的地方,所幸在不同的字符串解密邏輯後都跟了固定幾個字符串處理函數,大大方便了逆向工作。除此之外它應該還有一些風控的邏輯,但我沒有分析到就不談了。
令人費解的是它對gm文件的保護程度簡直弱到可怕,可以說是即dump即用了。
花了幾天時間來研究,若單純以破解為目的其實只需要1~2天就可以,比較費時間的是研究它的檢測原理,總的來說也是收獲了不少。
最後,文中若是有寫錯的地方還望指出,也歡迎技術交流!!!


 9346
9346

 被折叠的 条评论
为什么被折叠?
被折叠的 条评论
为什么被折叠?
 到【灌水乐园】发言


