


目的
本次比赛的目的是预测电子商务点击量、购物车添加量和订单。您将根据用户会话中的先前事件构建一个多目标推荐系统。
当前的推荐系统由具有不同方法的各种模型组成,从简单的矩阵分解到变压器型深度神经网络。然而,不存在可以同时优化多个目标的单一模型。在本次比赛中,您将构建一个条目来预测点击率、添加到购物车以及基于先前相同会话事件的转化率
数据结构
session-唯一的会话id。每个会话都包含一个按时间顺序排列的事件列表。
events-会话中事件的时间顺序。每个事件包含3条信息:
aid-关联事件的文章id(产品代码)
ts-事件的Unix时间戳(Unix时间是自1970年1月1日00:00:00 UTC以来经过的毫秒数)
type-事件类型,即产品是否被点击(点击)、添加到用户的购物车(购物车)或在会话期间订购(订单)
baseline
“测试数据”包含与训练数据类似的截断会话数据。任务是预测会话截断后单击的下一个辅助,以及添加到购物车和订单中的剩余辅助;每个会话类型最多可以预测20个值
对每种行动类型的召回进行评估,并对三个召回值进行加权平均:{“点击”:0.10,“购物车”:0.30,“订单”:0.60}。重要的是要使“订单”预测正确,因为它们承载了大部分权重:)
对于测试数据中的每个会话,您的任务是预测在测试会话的最后一个时间戳之后出现的每种类型的辅助值。换句话说,测试数据包含按时间戳截断的会话,您需要预测截断点之后发生的情况。
对于单击,每个会话只有一个基本真实值,这是会话期间单击的下一个辅助(尽管您仍然可以预测多达20个辅助值)。购物车和订单的基本事实包含在会话期间分别添加到购物车和订购的所有辅助值。
每个会话和类型组合应显示在提交中自己的session_type行上(每个会话3行),并且预测应以空格分隔。这可以在下面的sample_test_df中看到。。
代码
### Imports ###
#导入
import pandas as pd
from pathlib import Path
import os
import random
import numpy as np
import json
from datetime import timedelta
from collections import Counter
from tqdm.notebook import tqdm
from heapq import nlargest
import matplotlib.pyplot as plt
import seaborn as sns
sns.set_theme()
import warnings
warnings.filterwarnings('ignore')
#路径
### Paths ###
DATA_PATH = Path('C:/Users/Desktop/学校项目A/kaggle/')
TRAIN_PATH = DATA_PATH/'train.jsonl'
TEST_PATH = DATA_PATH/'test.jsonl'
SAMPLE_SUB_PATH = Path('C:/Users/Desktop/学校项目A/kaggle/sample_submission.CSV')
#数据加载
# Lets check how many lines the training data has!
with open(TRAIN_PATH, 'r') as f:
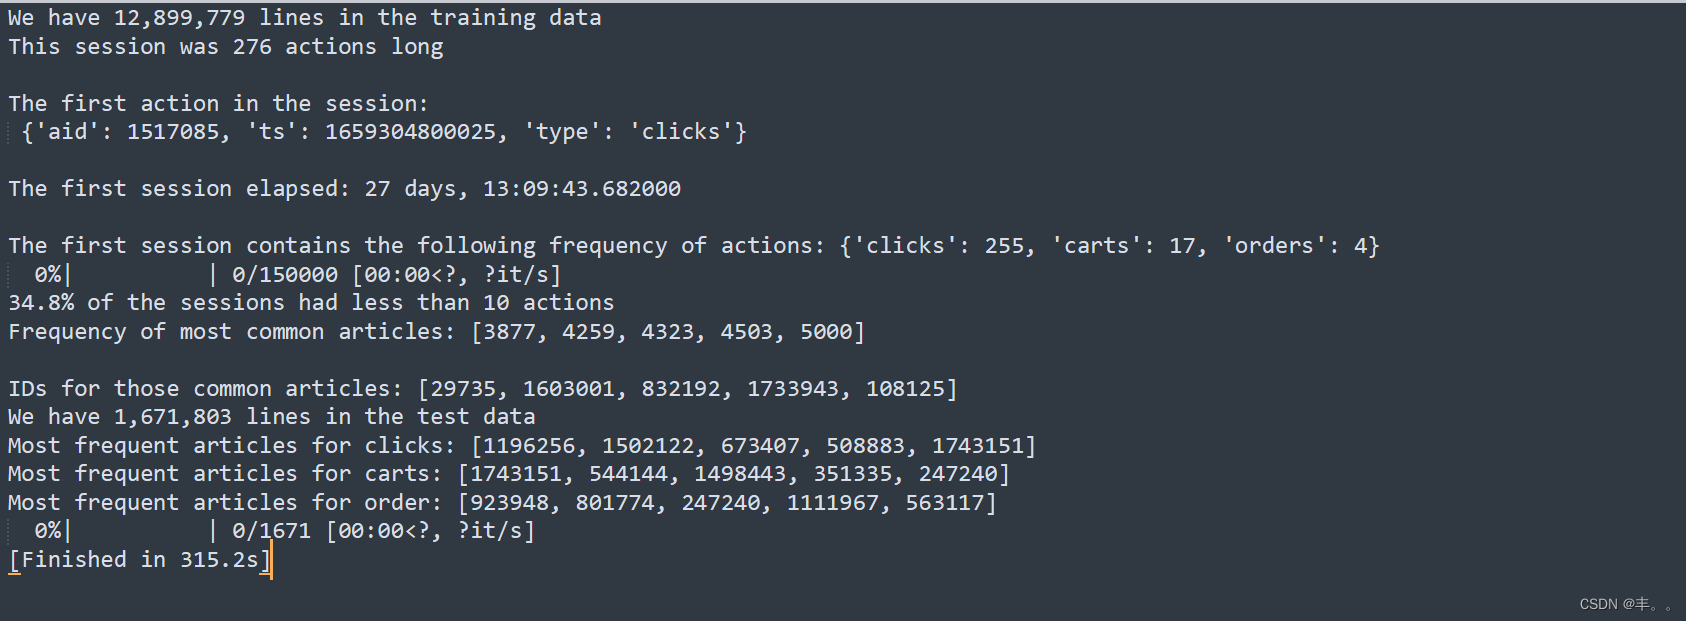
print(f"We have {len(f.readlines()):,} lines in the training data")
# Load in a sample to a pandas df
sample_size = 150000
chunks = pd.read_json(TRAIN_PATH, lines=True, chunksize = sample_size)
for c in chunks:
sample_train_df = c
break
sample_train_df.set_index('session', drop=True, inplace=True)
sample_train_df.head()
# Let's look at an example session and print out some basic info
# Sample the first session in the df
example_session = sample_train_df.iloc[0].item()
print(f'This session was {len(example_session)} actions long \n')
print(f'The first action in the session: \n {example_session[0]} \n')
# Time of session
time_elapsed = example_session[-1]["ts"] - example_session[0]["ts"]
# The timestamp is in milliseconds since 00:00:00 UTC on 1 January 1970
print(f'The first session elapsed: {str(timedelta(milliseconds=time_elapsed))} \n')
# Count the frequency of actions within the session
action_counts = {}
for action in example_session:
action_counts[action['type']] = action_counts.get(action['type'], 0) + 1
print(f'The first session contains the following frequency of actions: {action_counts}')
#This session was 276 actions long
#
#The first action in the session:
# {'aid': 1517085, 'ts': 1659304800025, 'type': 'clicks'}
#
#The first session elapsed: 27 days, 13:09:43.682000
#
#The first session contains the following frequency of actions: {'clicks': 255, 'carts': 17, 'orders': 4}
### Extract information from each session and add it to the df ###
action_counts_list, article_id_counts_list, session_length_time_list, session_length_action_list = ([] for i in range(4))
overall_action_counts = {}
overall_article_id_counts = {}
for i, row in tqdm(sample_train_df.iterrows(), total=len(sample_train_df)):
actions = row['events']
# Get the frequency of actions and article_ids
action_counts = {}
article_id_counts = {}
for action in actions:
action_counts[action['type']] = action_counts.get(action['type'], 0) + 1
article_id_counts[action['aid']] = article_id_counts.get(action['aid'], 0) + 1
overall_action_counts[action['type']] = overall_action_counts.get(action['type'], 0) + 1
overall_article_id_counts[action['aid']] = overall_article_id_counts.get(action['aid'], 0) + 1
# Get the length of the session
session_length_time = actions[-1]['ts'] - actions[0]['ts']
# Add to list
action_counts_list.append(action_counts)
article_id_counts_list.append(article_id_counts)
session_length_time_list.append(session_length_time)
session_length_action_list.append(len(actions))
sample_train_df['action_counts'] = action_counts_list
sample_train_df['article_id_counts'] = article_id_counts_list
sample_train_df['session_length_unix'] = session_length_time_list
sample_train_df['session_length_hours'] = sample_train_df['session_length_unix']*2.77778e-7 # Convert to hours
sample_train_df['session_length_action'] = session_length_action_list
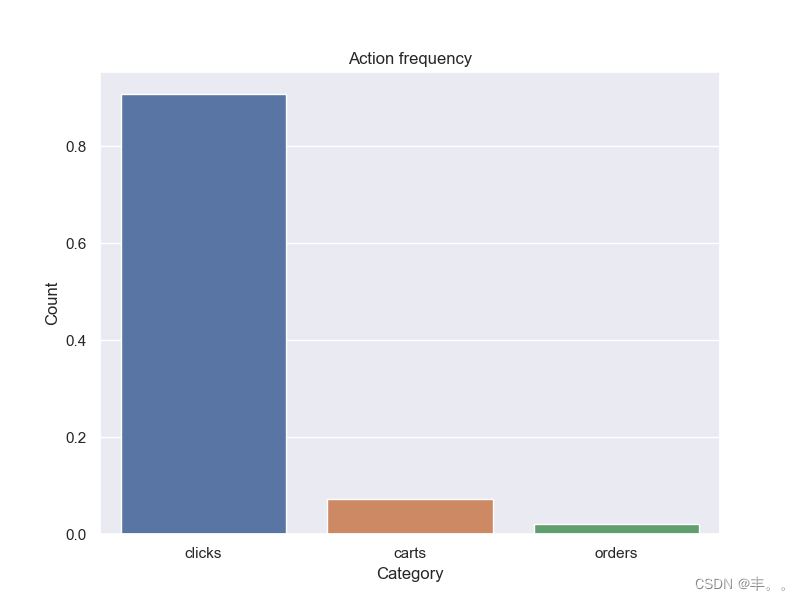
### Actions ###
total_actions = sum(overall_action_counts.values())
plt.figure(figsize=(8,6))
sns.barplot(x=list(overall_action_counts.keys()), y=[i/total_actions for i in overall_action_counts.values()]);
plt.title(f'Action frequency', fontsize=12)
plt.ylabel('Count', fontsize=12)
plt.xlabel('Category', fontsize=12)
plt.show()
fig, ax = plt.subplots(1,2, figsize=(24, 10))
p = sns.distplot(sample_train_df['session_length_action'], color="y", bins= 70, ax=ax[0], kde=False)
p.set_xlabel("Number of actions", fontsize = 16)
p.set_ylabel("Density", fontsize = 16)
p.set_title("Distribution of the number of actions taken in each session", fontsize = 14)
p.axvline(sample_train_df['session_length_action'].mean(), color='r', linestyle='--', label="Mean")
p = sns.distplot(sample_train_df['session_length_hours'], color="b", bins= 70, ax=ax[1], kde=False)
p.set_xlabel("Hours", fontsize = 16)
p.set_ylabel("Density", fontsize = 16)
p.set_title("Length of each session", fontsize = 16);
print(f'{round(len(sample_train_df[sample_train_df["session_length_action"]<10])/len(sample_train_df),3)*100}% of the sessions had less than 10 actions')
article_id_freq = list(overall_article_id_counts.values())
cut_off = [i for i in article_id_freq if i<30]
plt.figure(figsize=(8,6))
sns.distplot(cut_off, bins=30, kde=False);
plt.title(f'Article ID frequency', fontsize=12)
plt.ylabel('Count', fontsize=12)
plt.xlabel('Article', fontsize=12);
### Look at the most interacted with articles ###
print(f'Frequency of most common articles: {sorted(list(overall_article_id_counts.values()))[-5:]} \n')
res = nlargest(5, overall_article_id_counts, key = overall_article_id_counts.get)
print(f'IDs for those common articles: {res}')
with open(TEST_PATH, 'r') as f:
print(f"We have {len(f.readlines()):,} lines in the test data")
sample_size = 150
chunks = pd.read_json(TEST_PATH, lines=True, chunksize = sample_size)
for c in chunks:
sample_test_df = c
break
sample_test_df.head()
sample_submission = pd.read_csv(SAMPLE_SUB_PATH)
sample_submission.head()
sample_size = 150000
chunks = pd.read_json(TRAIN_PATH, lines=True, chunksize = sample_size)
clicks_article_list = []
carts_article_list = []
orders_article_list = []
for e, c in enumerate(chunks):
# Save time by not using all the data
if e > 2:
break
sample_train_df = c
for i, row in c.iterrows():
actions = row['events']
for action in actions:
if action['type'] == 'clicks':
clicks_article_list.append(action['aid'])
elif action['type'] == 'carts':
carts_article_list.append(action['aid'])
else:
orders_article_list.append(action['aid'])
# Create dictionaries with articles and their frequencies
article_click_freq = Counter(clicks_article_list)
article_carts_freq = Counter(carts_article_list)
article_order_freq = Counter(orders_article_list)
# Get the 20 most frequent articles for each action
top_click_article = nlargest(20, article_click_freq, key = article_click_freq.get)
top_carts_article = nlargest(20, article_carts_freq, key = article_carts_freq.get)
top_order_article = nlargest(20, article_order_freq, key = article_order_freq.get)
# Create a dict with this info
frequent_articles = {'clicks': top_click_article, 'carts':top_carts_article, 'order':top_order_article}
for action in ['clicks', 'carts', 'order']:
print(f'Most frequent articles for {action}: {frequent_articles[action][-5:]}')
test_data = pd.read_json(TEST_PATH, lines=True, chunksize=1000)
preds = []
for chunk in tqdm(test_data, total=1671):
for i, row in chunk.iterrows():
actions = row['events']
article_id_list = []
for action in actions:
article_id_list.append(action['aid'])
# Get 20 most common article ID for the session
article_freq = Counter(article_id_list)
top_articles = nlargest(20, article_freq, key = article_freq.get)
# Pad with most popular items in training
padding_size = -(20 - len(top_articles))
for action in ['clicks', 'carts', 'order']:
top_articles = top_articles + frequent_articles[action][padding_size:]
preds.append(" ".join([str(id) for id in top_articles]))
# Predict the 20 most common atricles for each test session
sample_submission['labels'] = preds
sample_submission.to_csv('submission.csv', index=False)
运行结果


 被折叠的 条评论
为什么被折叠?
被折叠的 条评论
为什么被折叠?
 到【灌水乐园】发言


