


 本文介绍如何使用matplotlib库在Python中绘制堆积条形图。通过具体的代码示例,展示了如何设置条形图的各项参数,如宽度、标签、标题等,并实现男女数据的对比展示。
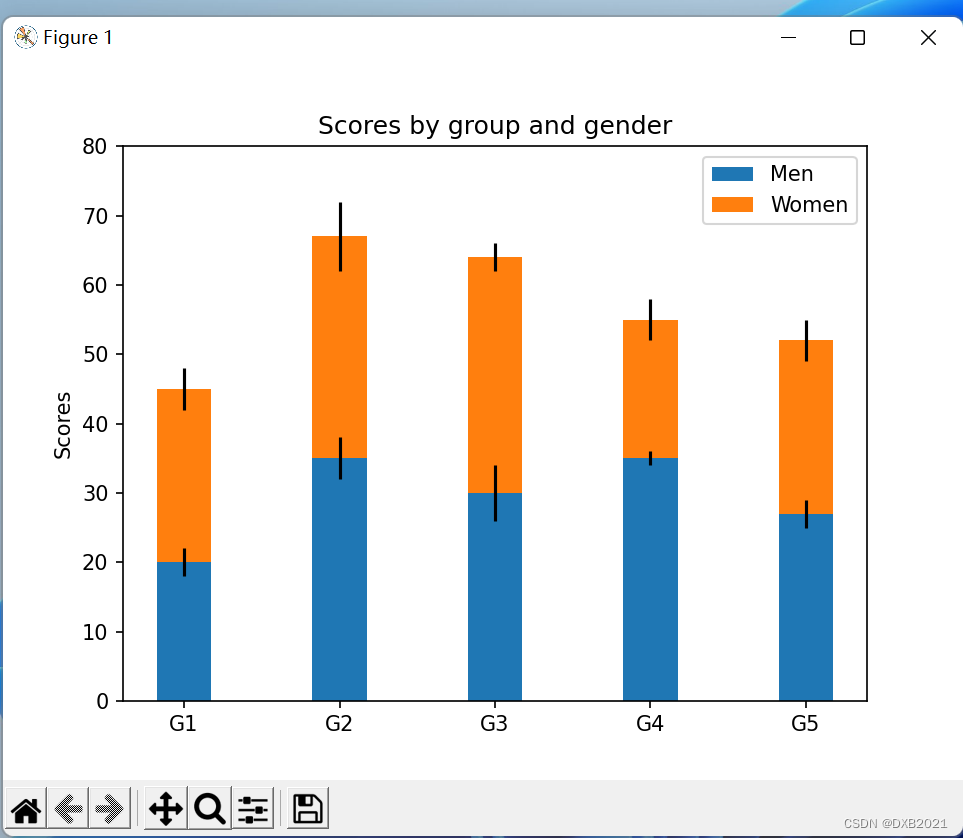
Stacked Bar Graph堆积条形图
import numpy as np
import matplotlib.pyplot as plt

N = 5
menMeans = (20, 35, 30, 35, 27)
womenMeans = (25, 32, 34, 20, 25)
menStd = (2, 3, 4, 1, 2)
womenStd = (3, 5, 2, 3, 3)
ind = np.arange(N)    # the x locations for the groups
width = 0.35       # the width of the bars: can also be len(x) sequence

p1 = plt.bar(ind, menMeans, width, yerr=menStd)
p2 = plt.bar(ind, womenMeans, width,
             bottom=menMeans, yerr=womenStd)

plt.ylabel('Scores')
plt.title('Scores by group and gender')
plt.xticks(ind, ('G1', 'G2', 'G3', 'G4', 'G5'))
plt.yticks(np.arange(0, 81, 10))
plt.legend((p1[0], p2[0]), ('Men', 'Women'))

plt.show()
width是条形bar的宽度
ylabel是y线的名称,Scores
title是标题,Scores by group and gender
matplotlib.pyplot.bar
matplotlib.pyplot.bar(x, height, width=0.8, bottom=None, *, align='center', data=None, **kwargs)
x: The x coordinates of the bars.
height:The height(s) of the bars.
width:The width(s) of the bars.default:0.8
bottom: The y coordinate(s) of the bars bases. default:0
align:align{'center', 'edge'}, default: 'center'
Alignment of the bars to the x coordinates:
'center': Center the base on the x positions.
'edge': Align the left edges of the bars with the x positions.
暂时没看懂xerr,xerr。也没看懂data。


 504
504

 被折叠的 条评论
为什么被折叠?
被折叠的 条评论
为什么被折叠?
 到【灌水乐园】发言


