


多条ROC代码, 用R语言自带数据库lung数据库,可直接出图
安装相应的R包
install.packages("nsROC")
#用rms包里的lung数据集
install.packages("rms")
library(nsROC)
library(pROC)
library(rio)
library(rms)
#使用lung这个数据集
#看一下lung这个数据集的表头
head(lung)
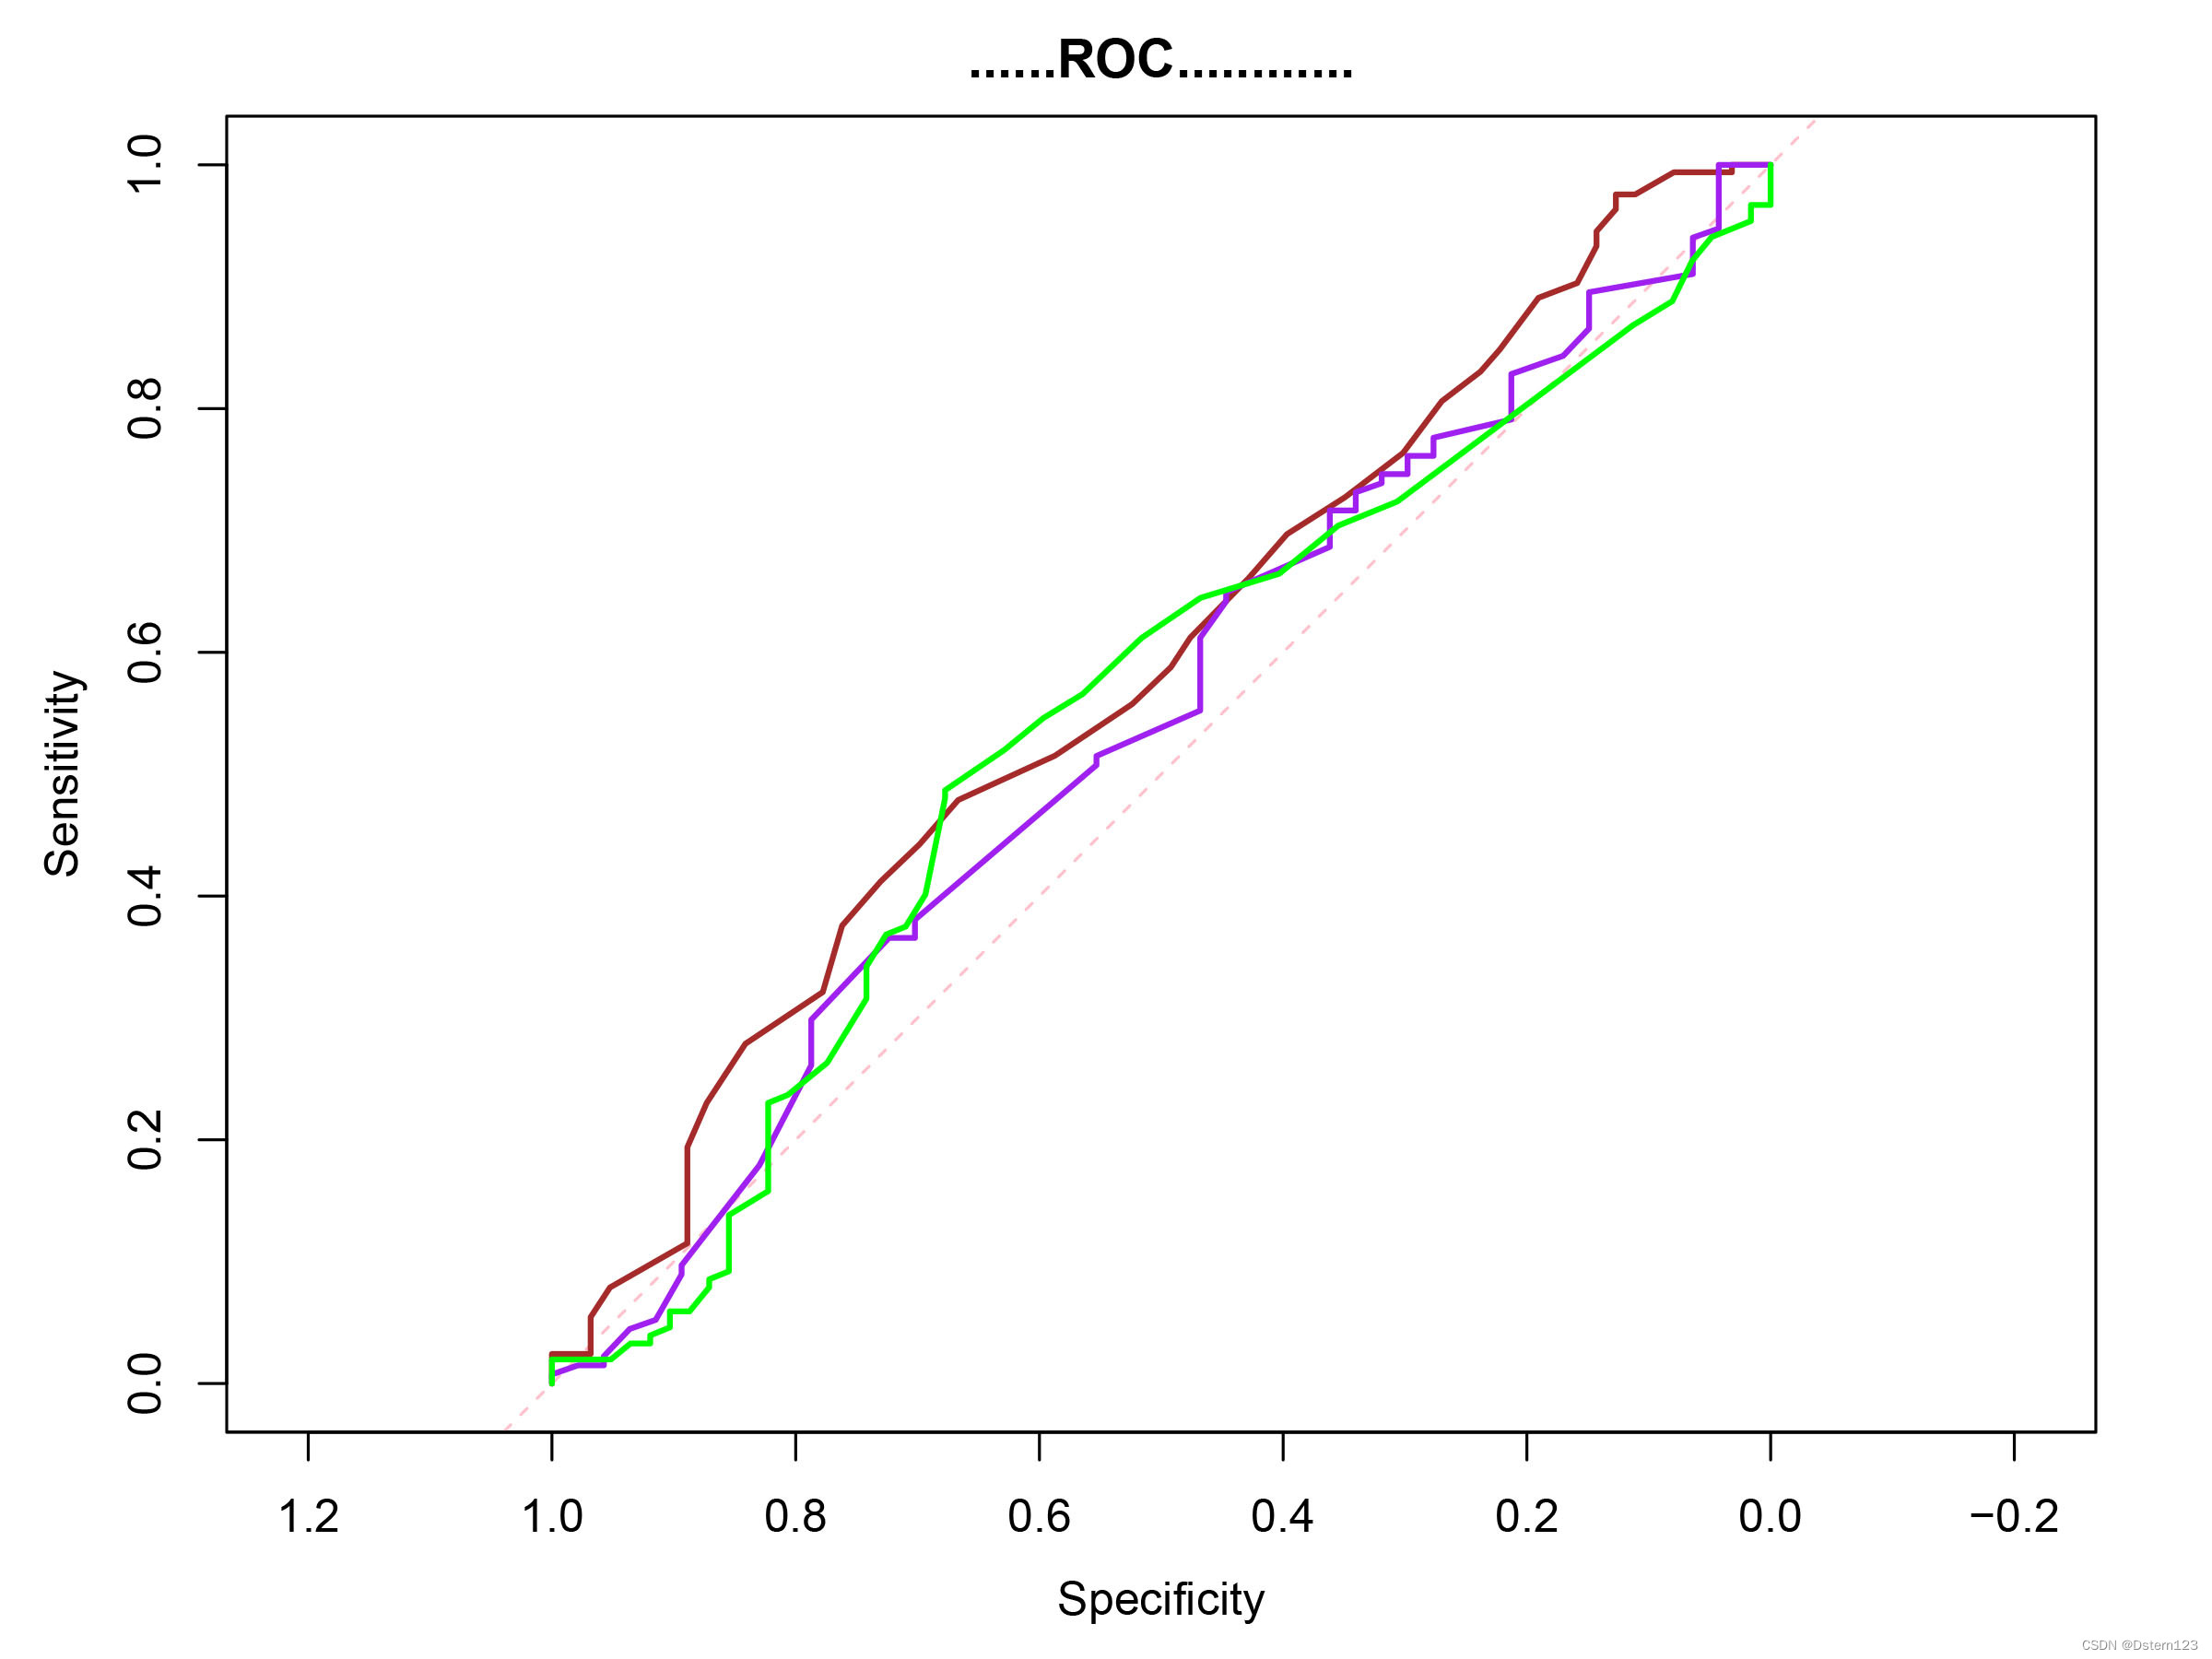
#第一条ROC,结局为status,预测指标为age
auc1 <- roc(status ~age, data = lung,smooth=F)
plot(auc1,
print.auc=F, #当前ROC的AUC是否在图中标出
print.thres=F, #当前ROC的cutoff是否在图中标出
main = "多组ROC曲线比较", #title图形的表头
col= "brown", #color of current line当前的线是棕色的
print.thres.col="grey", #cutoff的颜色,灰色
identity.col="pink", #0.5的界值线的颜色
#0.5的界值线的类型 1是实线 2是虚线 line type
identity.lty=2,
identity.lwd=1) #0.5的界值线的宽度 line width
#看一下食物摄入卡路里对结局的预测
auc2 <- roc(status~meal.cal, data = lung,smooth=F)
#看一下体重减少量对结局的预测
auc3<- roc(status~wt.loss, data = lung,smooth=F)
lines(auc2,col="purple")#第二条线是紫色的
lines(auc3,col="green")#第三条线是绿色的
#表的Legend,放在右下方
legend("bottomright",
legend=c( 'age','meal.cal','wt.loss' ),
col=c("brown","purple","green"),
lty=1)


 493
493


 被折叠的 条评论
为什么被折叠?
被折叠的 条评论
为什么被折叠?
 到【灌水乐园】发言


