


The Hypothesis Function

we will be trying out various values of θ0 and θ1 to try to find values which provide the best possible "fit" or the most representative "straight line" through the data points mapped on the x-y plane.
Cost Function
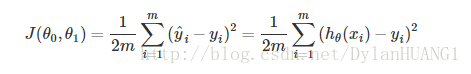
The best possible line will be such so that the average squared vertical distances of the scattered points from the line will be the least. In the best case, the line should pass through all the points of our training data set. In such a case the value of J(θ0,θ1) will be 0.
Gradient Descent
Why?
So we have our hypothesis function and we have a way of measuring how well it fits into the data. Now we need to estimate the parameters in hypothesis function. That's where gradient descent comes in.
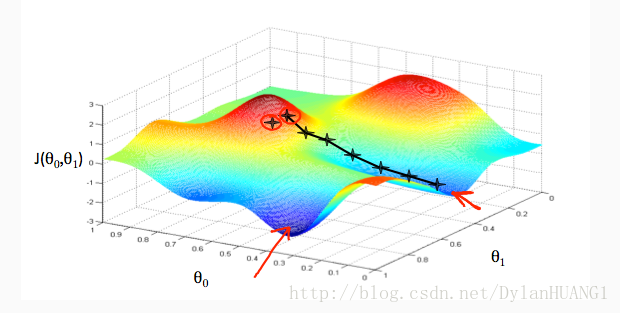
We put θ0 on the x axis and θ1 on the y axis, with the cost function on the vertical z axis. The points on our graph will be the result of the cost function using our hypothesis with those specific theta parameters.
We will know that we have succeeded when our cost function is at the very bottom of the pits in our graph, i.e. when its value is the minimum.
How
step 1 :  start with some θ

step 2 : keep changing θ0 and θ1 to reduce J(θ0,θ1) until we hopefully end up at a minimum
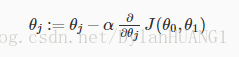
The gradient descent algorithm is:
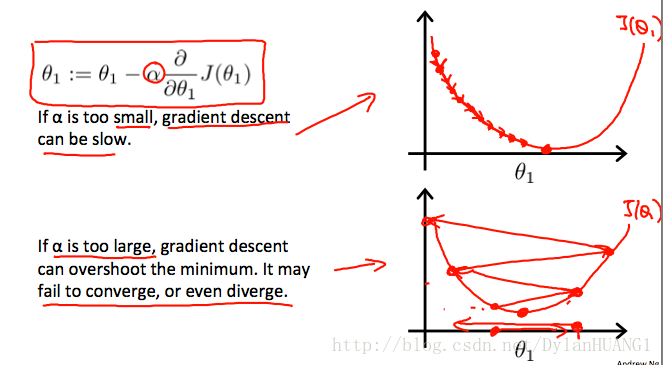
The following graph shows that when the slope is negative, the value of θ1 increases and when it is positive, the value of θ1 decreases
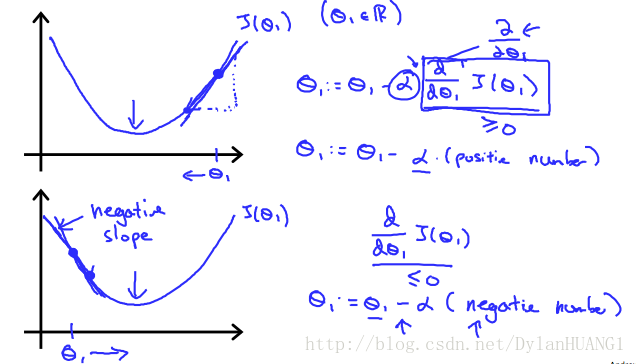
On a side note, we should adjust our parameter α to ensure that the gradient descent algorithm converges in a reasonable time. Failure to converge or too much time to obtain the minimum value imply that our step size is wrong.
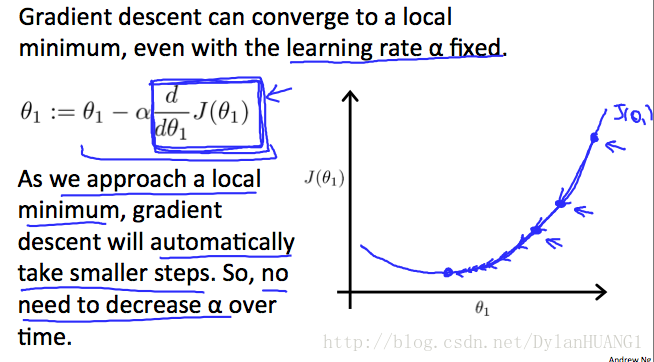
fixed α
When specifically applied to the case of linear regression, a new form of the gradient descent equation can be derived. We can substitute our actual cost function and our actual hypothesis function and modify the equation to :
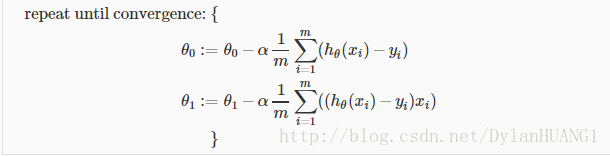
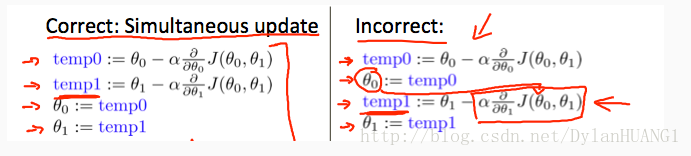
 where m is the size of the training set, θ0 a constant that will be changing simultaneously with θ1 and xi,yi are values of the given training set (data).

 The point of all this is that if we start with a guess for our hypothesis and then repeatedly apply these gradient descent equations, our hypothesis will become more and more accurate.


 482
482

 被折叠的 条评论
为什么被折叠?
被折叠的 条评论
为什么被折叠?
 到【灌水乐园】发言


