import numpy as np
import pandas as pd
import matplotlib. pyplot as plt
df= pd. read_csv( 'ex1data1-Copy1.txt' , header= None , names= [ 'population' , 'profit' ] )
df. head( )
population profit 0 6.1101 17.5920 1 5.5277 9.1302 2 8.5186 13.6620 3 7.0032 11.8540 4 5.8598 6.8233
df_np= df. values
df_np= np. insert( df_np, 0 , 1.0 , axis= 1 )
df_np. shape
(97, 3)
X= df_np[ : , 0 : 2 ]
X= np. matrix( X)
X. shape
(97, 2)
x1= df. iloc[ : , 0 ] . values
y= df. iloc[ : , 1 ] . values
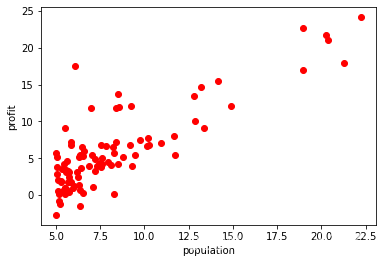
plt. scatter( x1, y, color= 'r' )
plt. xlabel( 'population' )
plt. ylabel( 'profit' )
plt. show( )
y= y. reshape( 97 , 1 )
y= np. matrix( y)
y. shape
(97, 1)
'X:97x2'
'theta:列向量,2x1 '
def cost ( X, y, theta) :
inn= np. sum ( np. power( ( X* theta- y) , 2 ) )
return inn/ ( 2 * len ( y) )
theta= [ 0.1 , 0.1 ]
theta= np. matrix( theta) . reshape( 2 , 1 )
theta. shape
(2, 1)
loss_0= cost( X, y, theta)
loss_0
25.449553111855668
def GredientDec ( X, y, theta, iters, alpha) :
parameters= X. shape[ 1 ]
loss= np. zeros( ( iters, 1 ) )
theta_fig= theta
for a in range ( iters) :
error= ( X* theta- y)
for j in range ( parameters) :
term= np. sum ( np. multiply( error, X[ : , j] ) )
theta[ j] = theta[ j] - ( alpha* term) / len ( y)
loss[ a] = cost( X, y, theta)
return theta, loss
np. seterr( invalid= 'ignore' )
theta, loss= GredientDec( X, y, theta= theta, iters= 1000 , alpha= 0.01 )
theta
matrix([[-3.78565572],
        [ 1.18197038]])
loss_new= cost( X, y, theta)
loss_new
4.478075461131649
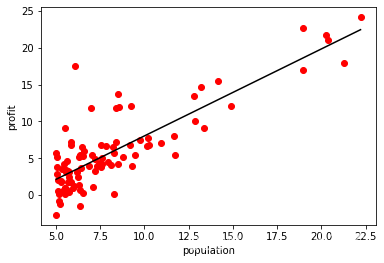
x= np. linspace( X[ : , 1 ] . min ( ) , X[ : , 1 ] . max ( ) , 100 )
y_fig= theta[ 0 ] + theta[ 1 ] * x
y_fig= y_fig. reshape( 100 , 1 )
x1= df. iloc[ : , 0 ] . values
y= df. iloc[ : , 1 ] . values
plt. scatter( x1, y, color= 'r' )
plt. plot( x, y_fig, color= 'k' )
plt. xlabel( 'population' )
plt. ylabel( 'profit' )
plt. show( )
iters= 1000
plt. plot( np. arange( iters) , loss, color= 'r' )
plt. xlabel( 'numbers of iter' )
plt. ylabel( 'loss of J(θ)' )
plt. show( )
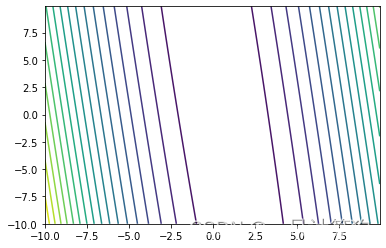
J= [ ]
for i in np. arange( - 10 , 10 , 0.1 ) :
for j in np. arange( - 10 , 10 , 0.1 ) :
theta= np. matrix( [ i, j] ) . reshape( 2 , 1 )
J. append( cost( X, y, theta= theta) )
J= np. array( J) . reshape( 200 , 200 )
plt. contour( np. arange( - 10 , 10 , 0.1 ) , np. arange( - 10 , 10 , 0.1 ) , J, levels= 20 )
<matplotlib.contour.QuadContourSet at 0x173d9b6a8b0>


 596
596

 被折叠的 条评论
为什么被折叠?
被折叠的 条评论
为什么被折叠?
 到【灌水乐园】发言


