


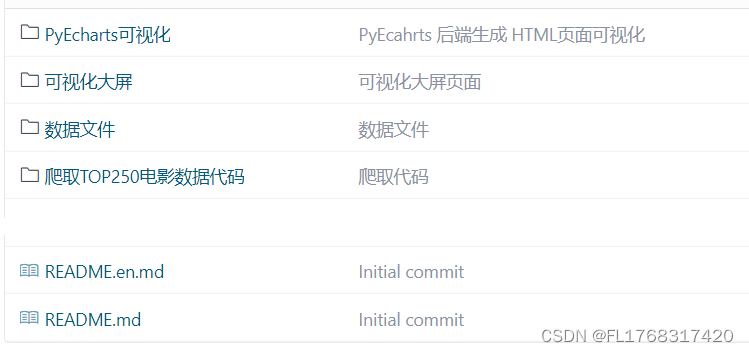
代码目录截图:
爬取数据代码:
"""
-*- coding: utf-8 -*-

"""

import re
import time
import requests
from bs4 import BeautifulSoup
import pandas as pd

# 数据存放在列表里
datas = []
# 遍历十页数据
for k in range(10):
    print("正在抓取第{}页数据...".format(k + 1))
    url = 'https://movie.douban.com/top250?start=' + str(k * 25)
    headers = {
        'User-agent': 'Mozilla/5.0 (Windows NT 10.0; Win64; x64) AppleWebKit/537.36 (KHTML, like Gecko) Chrome/102.0.5005.49 Safari/537.36 Edg/102.0.1245.14'
    }
    r = requests.get(url, headers=headers)
    soup = BeautifulSoup(r.text, 'html.parser')
    # 查找电影链接
    lists = soup.find_all('div', {'class': 'hd'})

    # 遍历每条电影链接
    for item in lists:
        href = item.a['href']
        # 休息一下,防止被封
        time.sleep(0.5)
        # 请求每条电影,获得详细信息
        response = requests.get(href, headers=headers)
        # 把获取好的电影数据打包成BeautifulSoup对象
        movie_soup = BeautifulSoup(response.text, 'html.parser')

        # 解析每条电影数据
        # 片名
        name = movie_soup.find('span', {'property': 'v:itemreviewed'}).text.split(' ')[0]
        # 上映年份
        year = movie_soup.find('span', {'class': 'year'}).text.replace('(', '').replace(')', '')
        # 评分
        score = movie_soup.find('strong', {'property': 'v:average'}).text
        # 评价人数
        votes = movie_soup.find('span', {'property': 'v:votes'}).text
        infos = movie_soup.find('div', {'id': 'info'}).text.split('\n')[1:11]
        # infos返回的是一个列表,我们只需要索引提取就好了
        # 导演
        director = infos[0].split(': ')[1]
        # 编剧
        scriptwriter = infos[1].split(': ')[1]
        # 主演
        actor = infos[2].split(': ')[1]
        # 类型
        filmtype = infos[3].split(': ')[1]
        # 国家/地区
        area = infos[4].split(': ')[1]

        # 数据清洗一下
        if '.' in area:
            area = infos[5].split(': ')[1].split(' / ')[0]
            # 语言
            language = infos[6].split(': ')[1].split(' / ')[0]
        else:
            area = infos[4].split(': ')[1].split(' / ')[0]
            # 语言
            language = infos[5].split(': ')[1].split(' / ')[0]
        if '大陆' in area or '中国香港' in area or '台湾' in area:
            area = '中国'
        if '戛纳' in area:
            area = '法国'
        # 时长
        times0 = movie_soup.find(attrs={'property': 'v:runtime'}).text
        times = re.findall('\d+', times0)[0]

        # 将数据写入列表
        datas.append({
            '片名': name,
            '上映年份': year,
            '评分': score,
            '评价人数': votes,
            '导演': director,
            '编剧': scriptwriter,
            '主演': actor,
            '类型': filmtype,
            '国家/地区': area,
            '语言': language,
            '时长(分钟)': times
        })
        print("电影《{0}》已爬取完成...".format(name))

# 写入到文件
df = pd.DataFrame(datas)
df.to_csv("豆瓣电影top250.csv", index=False, header=True, encoding='utf_8_sig')
电影可视化核心代码:
import pandas as pd
from pyecharts import options as opts
from pyecharts.charts import Bar


def getzoombar(data):
    year_counts = data['上映年份'].value_counts()
    year_counts.columns = ['上映年份', '数量']
    year_counts = year_counts.sort_index()
    c = (
        Bar()
            .add_xaxis(list(year_counts.index))
            .add_yaxis('上映数量', year_counts.values.tolist())
            .set_global_opts(
            title_opts=opts.TitleOpts(title='各年份上映电影数量'),
            yaxis_opts=opts.AxisOpts(name='上映数量'),
            xaxis_opts=opts.AxisOpts(name='上映年份'),
            datazoom_opts=[opts.DataZoomOpts(), opts.DataZoomOpts(type_='inside')], )
            .render('各年份上映电影数量.html')
    )


def getcountrybar(data):
    country_counts = data['国家/地区'].value_counts()
    country_counts.columns = ['国家/地区', '数量']
    country_counts = country_counts.sort_values(ascending=True)
    c = (
        Bar()
            .add_xaxis(list(country_counts.index)[-10:])
            .add_yaxis('地区上映数量', country_counts.values.tolist()[-10:])
            .reversal_axis()
            .set_global_opts(
            title_opts=opts.TitleOpts(title='地区上映电影数量'),
            yaxis_opts=opts.AxisOpts(name='国家/地区'),
            xaxis_opts=opts.AxisOpts(name='上映数量'),
        )
            .set_series_opts(label_opts=opts.LabelOpts(position="right"))
            .render('各地区上映电影数量前十.html')
    )


def getscorebar(data):
    df = data.sort_values(by='评价人数', ascending=True)
    c = (
        Bar()
            .add_xaxis(df['片名'].values.tolist()[-20:])
            .add_yaxis('评价人数', df['评价人数'].values.tolist()[-20:])
            .reversal_axis()
            .set_global_opts(
            title_opts=opts.TitleOpts(title='电影评价人数'),
            yaxis_opts=opts.AxisOpts(name='片名'),
            xaxis_opts=opts.AxisOpts(name='人数'),
            datazoom_opts=opts.DataZoomOpts(type_='inside'),
        )
            # 网址:https://www.heywhale.com/mw/project/5eb7958f366f4d002d783d4a
            # 在中间引入这段代码即可
            .set_series_opts(label_opts=opts.LabelOpts(position="right"))
            .render('电影评价人数前二十.html')
    )


if __name__ == '__main__':
    data = pd.read_csv('豆瓣电影top250.csv')
    getzoombar(data)
    getcountrybar(data)
    getscorebar(data)
python后端代码:
<!DOCTYPE html>
<html>
<head>
<meta charset="UTF-8">
<title>Awesome-pyecharts</title>
<script type="text/javascript" src="https://assets.pyecharts.org/assets/echarts.min.js"></script>
</head>
<body>
<div>
<div>
<div id="074ad51ad3724e29867be999d0cbc12a" class="chart-container" style="width:900px; height:500px;"></div>
<script>
var chart_074ad51ad3724e29867be999d0cbc12a = echarts.init(
document.getElementById('074ad51ad3724e29867be999d0cbc12a'), 'white', {renderer: 'canvas'});
var option_074ad51ad3724e29867be999d0cbc12a = {
"animation": true,
"animationThreshold": 2000,
"animationDuration": 1000,
"animationEasing": "cubicOut",
"animationDelay": 0,
"animationDurationUpdate": 300,
"animationEasingUpdate": "cubicOut",
"animationDelayUpdate": 0,
"color": [
"#c23531",
"#2f4554",
"#61a0a8",
"#d48265",
"#749f83",
"#ca8622",
"#bda29a",
"#6e7074",
"#546570",
"#c4ccd3",
"#f05b72",
"#ef5b9c",
"#f47920",
"#905a3d",
"#fab27b",
"#2a5caa",
"#444693",
"#726930",
"#b2d235",
"#6d8346",
"#ac6767",
"#1d953f",
"#6950a1",
"#918597"
],
"series": [
{
"type": "bar",
"name": "\u8bc4\u5206",
"legendHoverLink": true,
"data": [
1,
1,
1,
2,
1,
1,
4,
2,
5,
4,
4,
2,
3,
4,
3,
4,
7,
4,
2,
5,
4,
5,
2,
2,
5,
5,
6,
4,
2,
4,
1,
5,
1,
4,
3,
7,
8,
3,
3,
2,
5,
2,
3,
4,
2,
5,
4,
2,
7,
7,
3,
4,
3,
1,
3,
3,
3,
1,
3,
2,
2,
1,
1,
1,
2,
2,
1,
2,
1,
1,
1,
2,
1,
2,
1,
2,
3,
1,
2,
1,
2,
1,
1,
1,
1,
1,
1,
1,
1,
1,
1,
1,
1,
1,
1,
1
],
"showBackground": false,
"barMinHeight": 0,
"barCategoryGap": "20%",
"barGap": "30%",
"large": false,
"largeThreshold": 400,
"seriesLayoutBy": "column",
"datasetIndex": 0,
"clip": true,
"zlevel": 0,
"z": 2,
"label": {
"show": true,
"position": "top",
"margin": 8
}
}
],
"legend": [
{
"data": [
"\u8bc4\u5206"
],
"selected": {
"\u8bc4\u5206": true
},
"show": true,
"padding": 5,
"itemGap": 10,
"itemWidth": 25,
"itemHeight": 14
}
],
"tooltip": {
"show": true,
"trigger": "item",
"triggerOn": "mousemove|click",
"axisPointer": {
"type": "line"
},
"showContent": true,
"alwaysShowContent": false,
"showDelay": 0,
"hideDelay": 100,
"textStyle": {
"fontSize": 14
},
"borderWidth": 0,
"padding": 5
},
"xAxis": [
{
"name": "\u65f6\u957f(\u5206\u949f)",
"show": true,
"scale": false,
"nameLocation": "end",
"nameGap": 15,
"gridIndex": 0,
"inverse": false,
"offset": 0,
"splitNumber": 5,
"minInterval": 0,
"splitLine": {
"show": false,
"lineStyle": {
"show": true,
"width": 1,
"opacity": 1,
"curveness": 0,
"type": "solid"
}
},
"data": [
45,
65,
80,
81,
85,
86,
87,
88,
89,
90,
92,
93,
94,
95,
96,
97,
98,
99,
100,
101,
102,
103,
104,
105,
106,
107,
108,
109,
110,
111,
112,
113,
114,
115,
116,
117,
118,
119,
120,
121,
122,
123,
124,
125,
126,
127,
128,
129,
130,
132,
133,
134,
135,
136,
137,
138,
139,
140,
141,
142,
143,
144,
146,
147,
148,
149,
150,
152,
153,
154,
155,
157,
158,
161,
162,
163,
165,
166,
169,
170,
171,
173,
174,
175,
178,
179,
180,
189,
194,
195,
201,
202,
207,
229,
237,
238
]
}
],
"yAxis": [
{
"name": "\u8bc4\u5206",
"show": true,
"scale": false,
"nameLocation": "end",
"nameGap": 15,
"gridIndex": 0,
"inverse": false,
"offset": 0,
"splitNumber": 5,
"minInterval": 0,
"splitLine": {
"show": false,
"lineStyle": {
"show": true,
"width": 1,
"opacity": 1,
"curveness": 0,
"type": "solid"
}
}
}
],
"title": [
{
"text": "\u65f6\u957f(\u5206\u949f)\u4e0e\u8bc4\u5206\u5173\u7cfb",
"padding": 5,
"itemGap": 10
}
],
"dataZoom": [
{
"show": true,
"type": "slider",
"realtime": true,
"start": 20,
"end": 80,
"orient": "horizontal",
"zoomLock": false,
"filterMode": "filter"
},
{
"show": true,
"type": "inside",
"realtime": true,
"start": 20,
"end": 80,
"orient": "horizontal",
"zoomLock": false,
"filterMode": "filter"
}
]
};
chart_074ad51ad3724e29867be999d0cbc12a.setOption(option_074ad51ad3724e29867be999d0cbc12a);
</script>
</div>
<!-- 另一种 -->
<div>
<div id="f12bca97ed3d455f91e573c19e41a131" class="chart-container" style="width:900px; height:500px;"></div>
<script>
var chart_f12bca97ed3d455f91e573c19e41a131 = echarts.init(
document.getElementById('f12bca97ed3d455f91e573c19e41a131'), 'white', {renderer: 'canvas'});
var option_f12bca97ed3d455f91e573c19e41a131 = {
"animation": true,
"animationThreshold": 2000,
"animationDuration": 1000,
"animationEasing": "cubicOut",
"animationDelay": 0,
"animationDurationUpdate": 300,
"animationEasingUpdate": "cubicOut",
"animationDelayUpdate": 0,
"color": [
"#c23531",
"#2f4554",
"#61a0a8",
"#d48265",
"#749f83",
"#ca8622",
"#bda29a",
"#6e7074",
"#546570",
"#c4ccd3",
"#f05b72",
"#ef5b9c",
"#f47920",
"#905a3d",
"#fab27b",
"#2a5caa",
"#444693",
"#726930",
"#b2d235",
"#6d8346",
"#ac6767",
"#1d953f",
"#6950a1",
"#918597"
],
"series": [
{
"type": "bar",
"name": "\u8bc4\u4ef7\u4eba\u6570",
"legendHoverLink": true,
"data": [
1386595,
1396852,
1432305,
1455998,
1481561,
1492889,
1512750,
1529852,
1570444,
1661096,
1707331,
1718625,
1881182,
1910462,
1922890,
1938378,
1962392,
2039501,
2114778,
2610527
],
"showBackground": false,
"barMinHeight": 0,
"barCategoryGap": "20%",
"barGap": "30%",
"large": false,
"largeThreshold": 400,
"seriesLayoutBy": "column",
"datasetIndex": 0,
"clip": true,
"zlevel": 0,
"z": 2,
"label": {
"show": true,
"position": "right",
"margin": 8
},
"rippleEffect": {
"show": true,
"brushType": "stroke",
"scale": 2.5,
"period": 4
}
}
],
"legend": [
{
"data": [
"\u8bc4\u4ef7\u4eba\u6570"
],
"selected": {
"\u8bc4\u4ef7\u4eba\u6570": true
},
"show": true,
"padding": 5,
"itemGap": 10,
"itemWidth": 25,
"itemHeight": 14
}
],
"tooltip": {
"show": true,
"trigger": "item",
"triggerOn": "mousemove|click",
"axisPointer": {
"type": "line"
},
"showContent": true,
"alwaysShowContent": false,
"showDelay": 0,
"hideDelay": 100,
"textStyle": {
"fontSize": 14
},
"borderWidth": 0,
"padding": 5
},
"xAxis": [
{
"name": "\u8bc4\u4ef7\u4eba\u6570",
"show": true,
"scale": false,
"nameLocation": "end",
"nameGap": 15,
"gridIndex": 0,
"inverse": false,
"offset": 0,
"splitNumber": 5,
"minInterval": 0,
"splitLine": {
"show": false,
"lineStyle": {
"show": true,
"width": 1,
"opacity": 1,
"curveness": 0,
"type": "solid"
}
}
}
],
"yAxis": [
{
"name": "\u65f6\u957f(\u5206\u949f)",
"show": true,
"scale": false,
"nameLocation": "end",
"nameGap": 15,
"gridIndex": 0,
"inverse": false,
"offset": 0,
"splitNumber": 5,
"minInterval": 0,
"splitLine": {
"show": false,
"lineStyle": {
"show": true,
"width": 1,
"opacity": 1,
"curveness": 0,
"type": "solid"
}
},
"data": [
117,
95,
161,
130,
105,
103,
132,
165,
169,
90,
171,
109,
148,
117,
194,
171,
142,
125,
110,
142
]
}
],
"title": [
{
"text": "\u8bc4\u4ef7\u4eba\u6570\u4e0e\u65f6\u957f\u5173\u7cfb",
"padding": 5,
"itemGap": 10
}
],
"dataZoom": {
"show": true,
"type": "inside",
"realtime": true,
"start": 20,
"end": 80,
"orient": "horizontal",
"zoomLock": false,
"filterMode": "filter"
}
};
chart_f12bca97ed3d455f91e573c19e41a131.setOption(option_f12bca97ed3d455f91e573c19e41a131);
</script>
</div>
<!-- 另一种 -->
<div>
<div id="59ca29f3edb3443ea28f381d66d2dcba" class="chart-container" style="width:900px; height:500px;"></div>
<script>
var chart_59ca29f3edb3443ea28f381d66d2dcba = echarts.init(
document.getElementById('59ca29f3edb3443ea28f381d66d2dcba'), 'white', {renderer: 'canvas'});
var option_59ca29f3edb3443ea28f381d66d2dcba = {
"animation": true,
"animationThreshold": 2000,
"animationDuration": 1000,
"animationEasing": "cubicOut",
"animationDelay": 0,
"animationDurationUpdate": 300,
"animationEasingUpdate": "cubicOut",
"animationDelayUpdate": 0,
"color": [
"#c23531",
"#2f4554",
"#61a0a8",
"#d48265",
"#749f83",
"#ca8622",
"#bda29a",
"#6e7074",
"#546570",
"#c4ccd3",
"#f05b72",
"#ef5b9c",
"#f47920",
"#905a3d",
"#fab27b",
"#2a5caa",
"#444693",
"#726930",
"#b2d235",
"#6d8346",
"#ac6767",
"#1d953f",
"#6950a1",
"#918597"
],
"series": [
{
"type": "pie",
"clockwise": true,
"data": [
{
"name": 8.9,
"value": 40
},
{
"name": 8.8,
"value": 40
},
{
"name": 8.7,
"value": 40
},
{
"name": 9.1,
"value": 28
},
{
"name": 8.6,
"value": 22
},
{
"name": 9.3,
"value": 19
},
{
"name": 9.2,
"value": 17
},
{
"name": 9.0,
"value": 16
},
{
"name": 8.5,
"value": 10
},
{
"name": 9.4,
"value": 8
},
{
"name": 9.6,
"value": 4
},
{
"name": 9.5,
"value": 3
},
{
"name": 9.7,
"value": 1
},
{
"name": 8.4,
"value": 1
},
{
"name": 8.3,
"value": 1
}
],
"radius": [
"30%",
"75%"
],
"center": [
"40%",
"50%"
],
"roseType": "radius",
"label": {
"show": true,
"position": "top",
"margin": 8,
"formatter": "{d}%"
},
"rippleEffect": {
"show": true,
"brushType": "stroke",
"scale": 2.5,
"period": 4
}
}
],
"legend": [
{
"data": [
8.9,
8.8,
8.7,
9.1,
8.6,
9.3,
9.2,
9.0,
8.5,
9.4,
9.6,
9.5,
9.7,
8.4,
8.3
],
"selected": {},
"type": "scroll",
"show": true,
"left": "80%",
"orient": "vertical",
"padding": 5,
"itemGap": 10,
"itemWidth": 25,
"itemHeight": 14
}
],
"tooltip": {
"show": true,
"trigger": "item",
"triggerOn": "mousemove|click",
"axisPointer": {
"type": "line"
},
"showContent": true,
"alwaysShowContent": false,
"showDelay": 0,
"hideDelay": 100,
"textStyle": {
"fontSize": 14
},
"borderWidth": 0,
"padding": 5
},
"title": [
{
"text": "\u5404\u8bc4\u5206\u503c\u5360\u6bd4",
"padding": 5,
"itemGap": 10
}
]
};
chart_59ca29f3edb3443ea28f381d66d2dcba.setOption(option_59ca29f3edb3443ea28f381d66d2dcba);
</script>
</div>
<!-- 另一个 -->
<div>
<div id="8de4ea54223b4eeb8f34c18ce91184d3" class="chart-container" style="width:900px; height:500px;"></div>
<script>
var chart_8de4ea54223b4eeb8f34c18ce91184d3 = echarts.init(
document.getElementById('8de4ea54223b4eeb8f34c18ce91184d3'), 'white', {renderer: 'canvas'});
var option_8de4ea54223b4eeb8f34c18ce91184d3 = {
"animation": true,
"animationThreshold": 2000,
"animationDuration": 1000,
"animationEasing": "cubicOut",
"animationDelay": 0,
"animationDurationUpdate": 300,
"animationEasingUpdate": "cubicOut",
"animationDelayUpdate": 0,
"color": [
"#c23531",
"#2f4554",
"#61a0a8",
"#d48265",
"#749f83",
"#ca8622",
"#bda29a",
"#6e7074",
"#546570",
"#c4ccd3",
"#f05b72",
"#ef5b9c",
"#f47920",
"#905a3d",
"#fab27b",
"#2a5caa",
"#444693",
"#726930",
"#b2d235",
"#6d8346",
"#ac6767",
"#1d953f",
"#6950a1",
"#918597"
],
"series": [
{
"type": "bar",
"legendHoverLink": true,
"data": [
40,
40,
40,
28,
22,
19,
17,
16,
10,
8,
4,
3,
1,
1,
1
],
"showBackground": false,
"barMinHeight": 0,
"barCategoryGap": "20%",
"barGap": "30%",
"large": false,
"largeThreshold": 400,
"seriesLayoutBy": "column",
"datasetIndex": 0,
"clip": true,
"zlevel": 0,
"z": 2,
"label": {
"show": true,
"position": "top",
"margin": 8
}
}
],
"legend": [
{
"data": [
""
],
"selected": {
"": true
},
"show": true,
"padding": 5,
"itemGap": 10,
"itemWidth": 25,
"itemHeight": 14
}
],
"tooltip": {
"show": true,
"trigger": "item",
"triggerOn": "mousemove|click",
"axisPointer": {
"type": "line"
},
"showContent": true,
"alwaysShowContent": false,
"showDelay": 0,
"hideDelay": 100,
"textStyle": {
"fontSize": 14
},
"borderWidth": 0,
"padding": 5
},
"xAxis": [
{
"show": true,
"scale": false,
"nameLocation": "end",
"nameGap": 15,
"gridIndex": 0,
"axisLabel": {
"show": true,
"position": "top",
"rotate": 10,
"margin": 8
},
"inverse": false,
"offset": 0,
"splitNumber": 5,
"minInterval": 0,
"splitLine": {
"show": false,
"lineStyle": {
"show": true,
"width": 1,
"opacity": 1,
"curveness": 0,
"type": "solid"
}
},
"data": [
8.9,
8.8,
8.7,
9.1,
8.6,
9.3,
9.2,
9.0,
8.5,
9.4,
9.6,
9.5,
9.7,
8.4,
8.3
]
}
],
"yAxis": [
{
"show": true,
"scale": false,
"nameLocation": "end",
"nameGap": 15,
"gridIndex": 0,
"inverse": false,
"offset": 0,
"splitNumber": 5,
"minInterval": 0,
"splitLine": {
"show": false,
"lineStyle": {
"show": true,
"width": 1,
"opacity": 1,
"curveness": 0,
"type": "solid"
}
}
}
],
"title": [
{
"text": "\u8bc4\u5206\u503c\u5206\u5e03",
"padding": 5,
"itemGap": 10
}
],
"dataZoom": {
"show": true,
"type": "slider",
"realtime": true,
"start": 20,
"end": 80,
"orient": "horizontal",
"zoomLock": false,
"filterMode": "filter"
}
};
chart_8de4ea54223b4eeb8f34c18ce91184d3.setOption(option_8de4ea54223b4eeb8f34c18ce91184d3);
</script>
</div>
<!-- 第二个 -->
<div>
<div id="02be9d8de7894dc7a8e880c7b6d7050a" class="chart-container" style="width:900px; height:500px;top: 0;"></div>
<script>
var chart_02be9d8de7894dc7a8e880c7b6d7050a = echarts.init(
document.getElementById('02be9d8de7894dc7a8e880c7b6d7050a'), 'white', {renderer: 'canvas'});
var option_02be9d8de7894dc7a8e880c7b6d7050a = {
"animation": true,
"animationThreshold": 2000,
"animationDuration": 1000,
"animationEasing": "cubicOut",
"animationDelay": 0,
"animationDurationUpdate": 300,
"animationEasingUpdate": "cubicOut",
"animationDelayUpdate": 0,
"color": [
"#c23531",
"#2f4554",
"#61a0a8",
"#d48265",
"#749f83",
"#ca8622",
"#bda29a",
"#6e7074",
"#546570",
"#c4ccd3",
"#f05b72",
"#ef5b9c",
"#f47920",
"#905a3d",
"#fab27b",
"#2a5caa",
"#444693",
"#726930",
"#b2d235",
"#6d8346",
"#ac6767",
"#1d953f",
"#6950a1",
"#918597"
],
"series": [
{
"type": "bar",
"name": "\u8bc4\u4ef7\u4eba\u6570",
"legendHoverLink": true,
"data": [
1385745,
1396092,
1431451,
1454677,
1480505,
1491534,
1511596,
1528997,
1569125,
1660010,
1706491,
1717515,
1880131,
1909429,
1921776,
1937374,
1961207,
2038426,
2113761,
2609059
],
"showBackground": false,
"barMinHeight": 0,
"barCategoryGap": "20%",
"barGap": "30%",
"large": false,
"largeThreshold": 400,
"seriesLayoutBy": "column",
"datasetIndex": 0,
"clip": true,
"zlevel": 0,
"z": 2,
"label": {
"show": true,
"position": "right",
"margin": 8
},
"rippleEffect": {
"show": true,
"brushType": "stroke",
"scale": 2.5,
"period": 4
}
}
],
"legend": [
{
"data": [
"\u8bc4\u4ef7\u4eba\u6570"
],
"selected": {
"\u8bc4\u4ef7\u4eba\u6570": true
},
"show": true,
"padding": 5,
"itemGap": 10,
"itemWidth": 25,
"itemHeight": 14
}
],
"tooltip": {
"show": true,
"trigger": "item",
"triggerOn": "mousemove|click",
"axisPointer": {
"type": "line"
},
"showContent": true,
"alwaysShowContent": false,
"showDelay": 0,
"hideDelay": 100,
"textStyle": {
"fontSize": 14
},
"borderWidth": 0,
"padding": 5
},
"xAxis": [
{
"name": "\u4eba\u6570",
"show": true,
"scale": false,
"nameLocation": "end",
"nameGap": 15,
"gridIndex": 0,
"inverse": false,
"offset": 0,
"splitNumber": 5,
"minInterval": 0,
"splitLine": {
"show": false,
"lineStyle": {
"show": true,
"width": 1,
"opacity": 1,
"curveness": 0,
"type": "solid"
}
}
}
],
"yAxis": [
{
"name": "\u7247\u540d",
"show": true,
"scale": false,
"nameLocation": "end",
"nameGap": 15,
"gridIndex": 0,
"inverse": false,
"offset": 0,
"splitNumber": 5,
"minInterval": 0,
"splitLine": {
"show": false,
"lineStyle": {
"show": true,
"width": 1,
"opacity": 1,
"curveness": 0,
"type": "solid"
}
},
"data": [
"\u5f53\u5e78\u798f\u6765\u6572\u95e8",
"\u5927\u8bdd\u897f\u6e38\u4e4b\u5927\u5723\u5a36\u4eb2",
"\u6454\u8de4\u5427\uff01\u7238\u7238",
"\u7eff\u76ae\u4e66",
"\u5bfb\u68a6\u73af\u6e38\u8bb0",
"\u695a\u95e8\u7684\u4e16\u754c",
"\u8ba9\u5b50\u5f39\u98de",
"\u6d77\u4e0a\u94a2\u7434\u5e08",
"\u661f\u9645\u7a7f\u8d8a",
"\u6026\u7136\u5fc3\u52a8",
"\u4e09\u50bb\u5927\u95f9\u5b9d\u83b1\u575e",
"\u75af\u72c2\u52a8\u7269\u57ce",
"\u76d7\u68a6\u7a7a\u95f4",
"\u6211\u4e0d\u662f\u836f\u795e",
"\u6cf0\u5766\u5c3c\u514b\u53f7",
"\u9738\u738b\u522b\u59ec",
"\u963f\u7518\u6b63\u4f20",
"\u5343\u4e0e\u5343\u5bfb",
"\u8fd9\u4e2a\u6740\u624b\u4e0d\u592a\u51b7",
"\u8096\u7533\u514b\u7684\u6551\u8d4e"
]
}
],
"title": [
{
"text": "\u7535\u5f71\u8bc4\u4ef7\u4eba\u6570",
"padding": 5,
"itemGap": 10
}
],
"dataZoom": {
"show": true,
"type": "inside",
"realtime": true,
"start": 20,
"end": 80,
"orient": "horizontal",
"zoomLock": false,
"filterMode": "filter"
}
};
chart_02be9d8de7894dc7a8e880c7b6d7050a.setOption(option_02be9d8de7894dc7a8e880c7b6d7050a);
</script>
</div>
<!-- 第三个 -->
<div>
<div id="31067e39fd6a426aa76345fd6c6ac84b" class="chart-container" style="width:900px; height:500px;"></div>
<script>
var chart_31067e39fd6a426aa76345fd6c6ac84b = echarts.init(
document.getElementById('31067e39fd6a426aa76345fd6c6ac84b'), 'white', {renderer: 'canvas'});
var option_31067e39fd6a426aa76345fd6c6ac84b = {
"animation": true,
"animationThreshold": 2000,
"animationDuration": 1000,
"animationEasing": "cubicOut",
"animationDelay": 0,
"animationDurationUpdate": 300,
"animationEasingUpdate": "cubicOut",
"animationDelayUpdate": 0,
"color": [
"#c23531",
"#2f4554",
"#61a0a8",
"#d48265",
"#749f83",
"#ca8622",
"#bda29a",
"#6e7074",
"#546570",
"#c4ccd3",
"#f05b72",
"#ef5b9c",
"#f47920",
"#905a3d",
"#fab27b",
"#2a5caa",
"#444693",
"#726930",
"#b2d235",
"#6d8346",
"#ac6767",
"#1d953f",
"#6950a1",
"#918597"
],
"series": [
{
"type": "bar",
"name": "\u8bc4\u5206",
"legendHoverLink": true,
"data": [
1,
1,
1,
1,
1,
1,
1,
1,
2,
1,
1,
1,
1,
1,
1,
1,
1,
1,
1,
2,
2,
3,
4,
2,
3,
5,
2,
7,
13,
7,
1,
8,
4,
6,
5,
9,
8,
10,
13,
4,
9,
4,
10,
9,
13,
8,
5,
11,
9,
10,
10,
5,
6,
2,
1
],
"showBackground": false,
"barMinHeight": 0,
"barCategoryGap": "20%",
"barGap": "30%",
"large": false,
"largeThreshold": 400,
"seriesLayoutBy": "column",
"datasetIndex": 0,
"clip": true,
"zlevel": 0,
"z": 2,
"label": {
"show": true,
"position": "top",
"margin": 8
}
}
],
"legend": [
{
"data": [
"\u8bc4\u5206"
],
"selected": {
"\u8bc4\u5206": true
},
"show": true,
"padding": 5,
"itemGap": 10,
"itemWidth": 25,
"itemHeight": 14
}
],
"tooltip": {
"show": true,
"trigger": "item",
"triggerOn": "mousemove|click",
"axisPointer": {
"type": "line"
},
"showContent": true,
"alwaysShowContent": false,
"showDelay": 0,
"hideDelay": 100,
"textStyle": {
"fontSize": 14
},
"borderWidth": 0,
"padding": 5
},
"xAxis": [
{
"name": "\u4e0a\u6620\u5e74\u4efd",
"show": true,
"scale": false,
"nameLocation": "end",
"nameGap": 15,
"gridIndex": 0,
"inverse": false,
"offset": 0,
"splitNumber": 5,
"minInterval": 0,
"splitLine": {
"show": false,
"lineStyle": {
"show": true,
"width": 1,
"opacity": 1,
"curveness": 0,
"type": "solid"
}
},
"data": [
1931,
1936,
1939,
1940,
1950,
1952,
1953,
1954,
1957,
1960,
1961,
1965,
1966,
1968,
1972,
1974,
1975,
1979,
1982,
1984,
1986,
1987,
1988,
1989,
1990,
1991,
1992,
1993,
1994,
1995,
1996,
1997,
1998,
1999,
2000,
2001,
2002,
2003,
2004,
2005,
2006,
2007,
2008,
2009,
2010,
2011,
2012,
2013,
2014,
2015,
2016,
2017,
2018,
2019,
2020
]
}
],
"yAxis": [
{
"name": "\u8bc4\u5206",
"show": true,
"scale": false,
"nameLocation": "end",
"nameGap": 15,
"gridIndex": 0,
"inverse": false,
"offset": 0,
"splitNumber": 5,
"minInterval": 0,
"splitLine": {
"show": false,
"lineStyle": {
"show": true,
"width": 1,
"opacity": 1,
"curveness": 0,
"type": "solid"
}
}
}
],
"title": [
{
"text": "\u5404\u5e74\u4efd\u4e0a\u6620\u7535\u5f71\u8bc4\u5206",
"padding": 5,
"itemGap": 10
}
],
"dataZoom": [
{
"show": true,
"type": "slider",
"realtime": true,
"start": 20,
"end": 80,
"orient": "horizontal",
"zoomLock": false,
"filterMode": "filter"
},
{
"show": true,
"type": "inside",
"realtime": true,
"start": 20,
"end": 80,
"orient": "horizontal",
"zoomLock": false,
"filterMode": "filter"
}
]
};
chart_31067e39fd6a426aa76345fd6c6ac84b.setOption(option_31067e39fd6a426aa76345fd6c6ac84b);
</script>
</div>
</div>
</body>
</html>完整源码下载:https://download.csdn.net/download/FL1768317420/89231372


 被折叠的 条评论
为什么被折叠?
被折叠的 条评论
为什么被折叠?
 到【灌水乐园】发言


