


1 plt.figure() :创建画布
plt.figure(num=None, figsize=None, facecolor=None, edgecolor=None, clear=False, )num:画布序号,一般默认是从1递增
figsize=(长,宽):画布尺寸,常用
facecolor:背景色,默认白色
edgecolor:边缘色,默认白色
clear:是否清除原来的画布,默认False自动创建新画布
2 plt.subplot() :创建子图
plt.subplot(numRows, numCols, plotNum)numRows:行数
numCols:列数,画布被分成numRows行和numCols列
plotNum:按照从左到右,从上到下的顺序对每个子图进行编号。 该参数可以指定画图区域。
import matplotlib.pyplot as plt
x = [1, 2, 3, 4]
y1 = [1, 2, 3, 4]
y2 = [1, 4, 9, 16]
y3 = [2, 6, 6, 8]
y4 = [1, -3, 5, 7]
plt.figure()
plt.subplot(221)
plt.plot(x, y1, 'r')
plt.subplot(222)
plt.plot(x, y2)
plt.subplot(223)
plt.plot(x, y3,'g')
plt.subplot(224)
plt.plot(x, y4,'y')
plt.show() 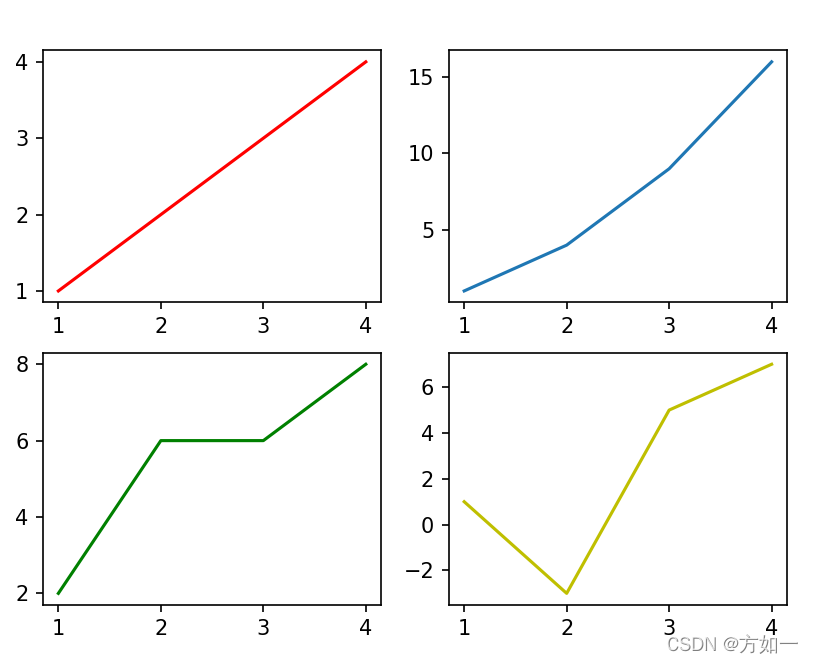
3 plt.subplots_adjust():调整子图间的距离
plt.subplots_adjust(left=None, bottom=None, right=None, top=None,
                wspace=None, hspace=None)
left:默认为0.125,子图(subplot)距画板(figure)左边的距离
right:默认为0.9,子图(subplot)距画板(figure)右边的距离
bottom:默认为0.1,子图(subplot)距画板(figure)底部的距离
top:默认为0.9,子图(subplot)距画板(figure)顶部的距离
wspace:默认为0.2,子图水平间距
hspace:默认为0.2,子图垂直间距
import matplotlib.pyplot as plt
x = [1, 2, 3, 4]
y1 = [1, 2, 3, 4]
y2 = [1, 4, 9, 16]
y3 = [2, 6, 6, 8]
y4 = [1, -3, 5, 7]
plt.figure()
plt.subplot(221)
plt.plot(x, y1, 'r')
plt.subplot(222)
plt.plot(x, y2)
plt.subplot(223)
plt.plot(x, y3,'g')
plt.subplot(224)
plt.plot(x, y4,'y')
plt.subplots_adjust(hspace=0.5, wspace=0.5)
plt.show()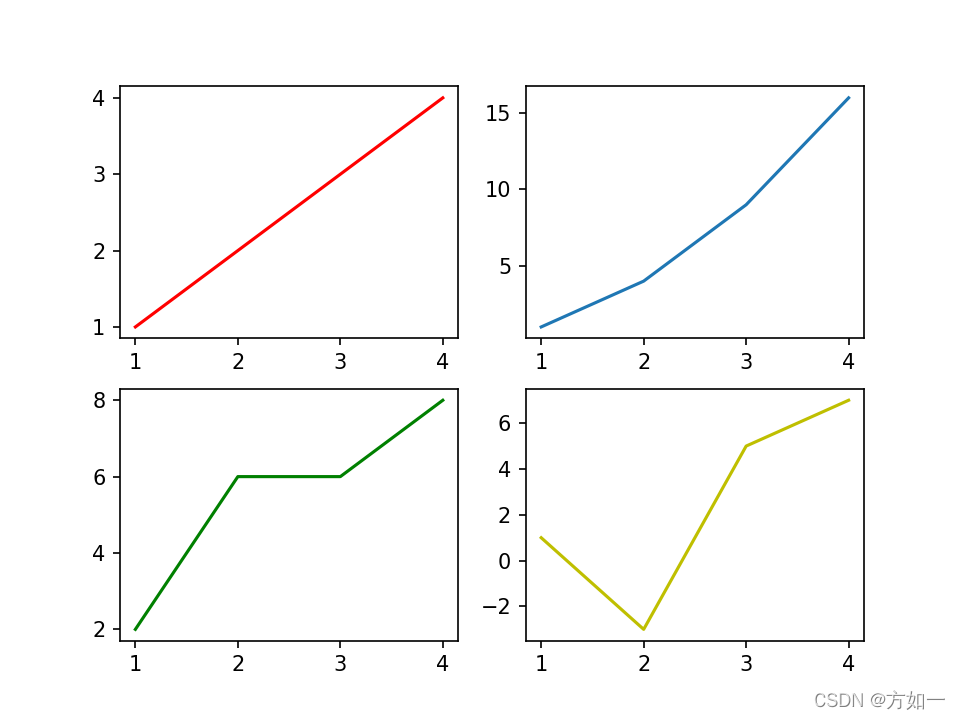
4 plt.plot():画图
plt.plot(x, y, linestyle, color, linewidth, label)x,y:分别是x轴数据和y轴数据、linestyle:线条类型、color:颜色(默认值为蓝色'b')、linewidth:线宽度、label:曲线标签,后使用plt.legend( )创建图例。
import matplotlib.pyplot as plt
y = [1, 2, 20, 50]
plt.figure()
plt.plot(y) #只给y时,x默认为range(len(y)),即0、1、2、3...len(y)-1
plt.show()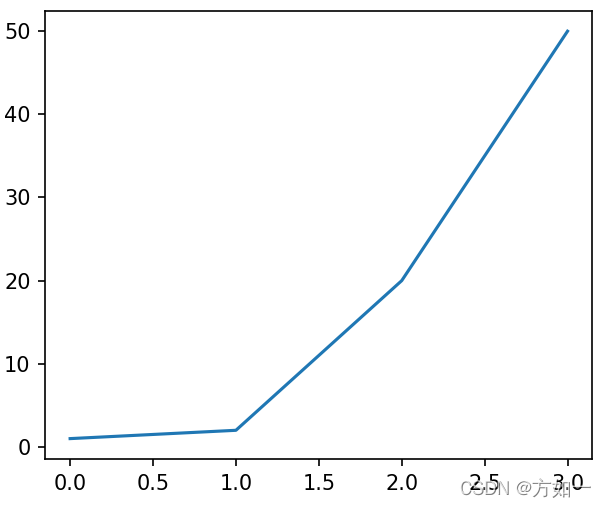
import matplotlib.pyplot as plt
x = [1, 2, 3, 4]
y1 = [1, 2, 3, 4]
y2 = [1, 4, 9, 16]
plt.figure()
plt.plot(x, y1) #同一个图画多条曲线
plt.plot(x, y2) #可看出绘制多条线条时,系统会自动更改线条颜色,第一个默认值为蓝色'b'
plt.show()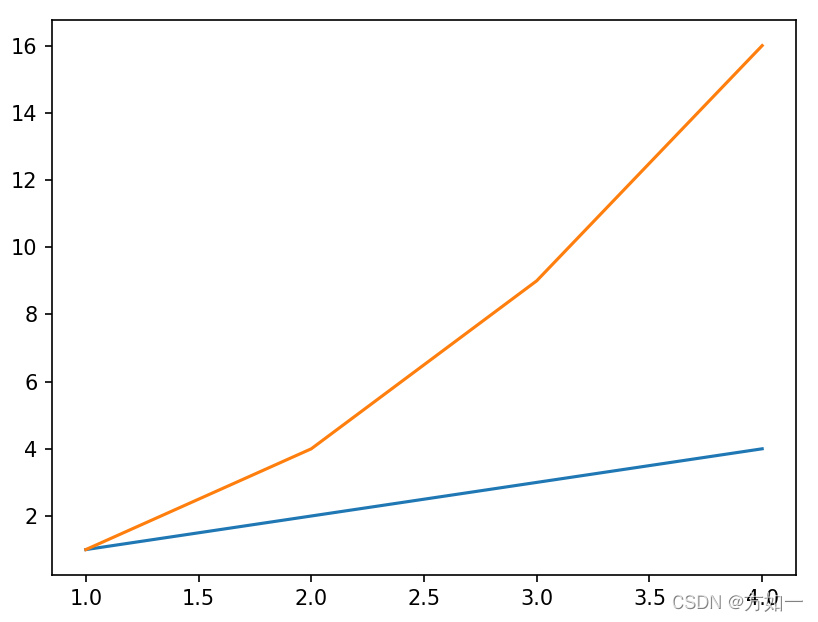
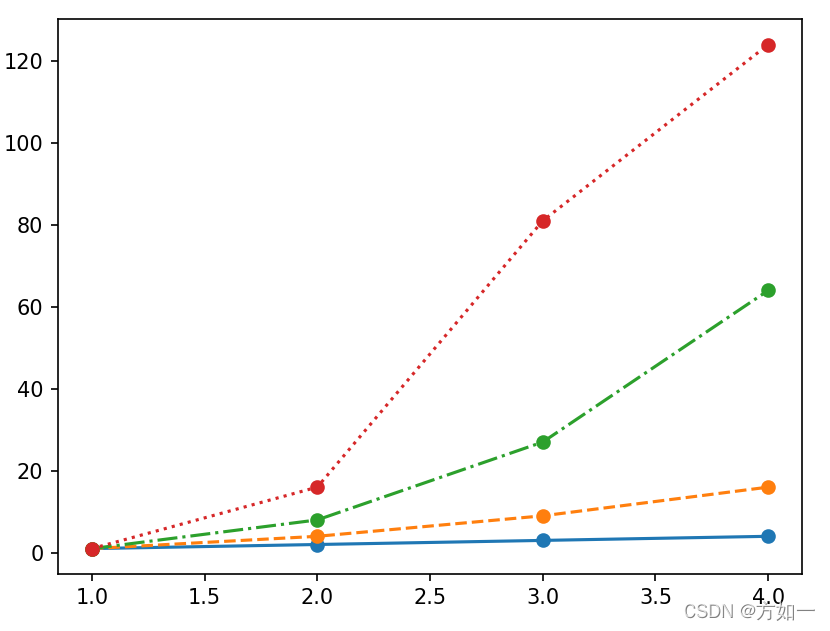
import matplotlib.pyplot as plt
x = [1, 2, 3, 4]
y1 = [1, 2, 3, 4]
y2 = [1, 4, 9, 16]
y3 = [1, 8, 27, 64]
y4 = [1, 16, 81, 124]
plt.figure()
plt.plot(x, y1, linestyle='-')  #实线
plt.plot(x, y2, linestyle='--') #虚线
plt.plot(x, y3, linestyle='-.') #折点线
plt.plot(x, y4, linestyle=':')  #点线
plt.show()
5 plt.scatter():绘制散点图
plt.scatter(x, y, s=None)x,y:散点的坐标、s:散点的面积、color:散点的颜色(默认值为蓝色'b')
import matplotlib.pyplot as plt
x = [1, 2, 3, 4]
y = [1, 2, 20, 50]
plt.figure()
plt.scatter(x, y, s=10)
plt.show()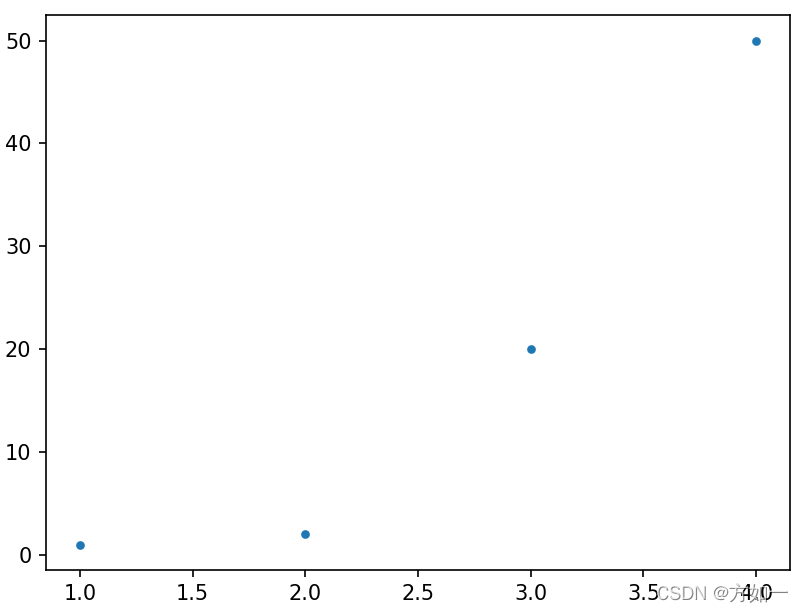
6 plt.legend():创建图例
在plt.plot()里添加label属性后,可调用plt.legend(),产生legend
7 plt.xlabel(' '):在横坐标添加标签
字符串中不可以包含中文
8 plt.title(' '):增加主题
字符串中不可以包含中文
import matplotlib.pyplot as plt
x = [1, 2, 3, 4]
y = [1, 2, 20, 50]
plt.figure()
plt.plot(x, y,label='line1')
plt.legend()          #创建图例
plt.xlabel("X axis")  #x轴标签
plt.ylabel("Y axis")  #y轴标签
plt.title("figure1")  #主题
plt.show() 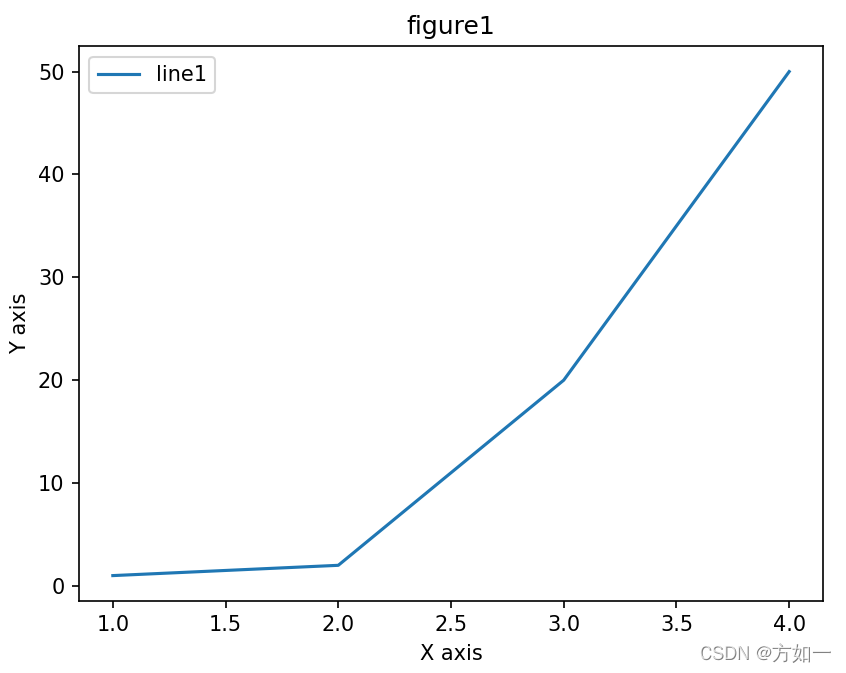
9 plt.savefig( ):将图表保存到文件中
plt.savefig('存储位置'+'照片名'+'.照片类型')10 plt.show( ):展现画布
进阶学习


 4467
4467


 被折叠的 条评论
为什么被折叠?
被折叠的 条评论
为什么被折叠?
 到【灌水乐园】发言


