预处理步骤


当我们拿到一批原始的数据
首先要明确有多少特征,哪些是连续的,哪些是类别的。
检查有没有缺失值,对确实的特征选择恰当方式进行弥补,使数据完整。
对连续的数值型特征进行标准化,使得均值为0,方差为1。
对类别型的特征进行one-hot编码。
将需要转换成类别型数据的连续型数据进行二值化。
为防止过拟合或者其他原因,选择是否要将数据进行正则化。
在对数据进行初探之后发现效果不佳,可以尝试使用多项式方法,寻找非线性的关系。
根据实际问题分析是否需要对特征进行相应的函数转换。
数据平滑处理:log1p( ) 和 exmp1( )
 log1p = log(x+1)      即ln(x+1)
    expm1 = exp(x)-1
log1p函数有它存在的意义,即保证了x数据的有效性,当x很小时(如 两个数值相减后得到x = 10^{-16}),由于太小超过数值有效性,用log(x+1)计算得到结果为0,换作log1p则计算得到一个很小却不为0的结果,这便是它的意义(用泰勒公式来展开运算的)。
对于x的小值,这个函数提供了比exp(x) - 1更高的精度。log1p 和 expm1 互为逆运算
- 数据预处理时首先可以对偏度比较大的数据用og1p函数进行转化,使其更加服从高斯分布,此步处理可能会使我们后续的分类结果得到一个好的结果。
- 平滑问题很容易处理掉,导致模型的结果达不到一定的标准,log1p( )能够避免复值得问题 — 复值指一个自变量对应多个因变量
log1p( ) 的使用就像是一个数据压缩到了一个区间,与数据的标准类似。其逆运算就是expm1的函数。
由于使用的log1p()对数据进行了压缩,最后需要将预测出的平滑数据进行一个还原,而还原过程就是log1p的逆运算expm1。
>>> np.expm1(1e-10)
1.00000000005e-10
>>> np.exp(1e-10) - 1
1.000000082740371e-10
标准化/归一化
StandardScaler

标准化数据通过减去均值然后除以方差(或标准差),这种数据标准化方法经过处理后数据符合标准正态分布,即均值为0,标准差为1,适用于:如果数据的分布本身就服从正态分布,就可以用这个方法。
通常这种方法基本可用于有outlier的情况,但是,在计算方差和均值的时候outliers仍然会影响计算。所以,在出现outliers的情况下可能会出现转换后的数的不同feature分布完全不同的情况。
如下图,经过StandardScaler之后,横坐标与纵坐标的分布出现了很大的差异,这可能是outliers造成的。

MinMaxScaler
将特征缩放至特定区间,将特征缩放到给定的最小值和最大值之间,或者也可以将每个特征的最大绝对值转换至单位大小。这种方法是对原始数据的线性变换,将数据归一到[0,1]中间。转换函数为:

min_max_scaler = sklearn.preprocessing.MinMaxScaler()
min_max_scaler.fit_transform(X_train)
这种方法有个缺陷就是当有新数据加入时,可能导致max和min的变化,需要重新定义。敲黑板,这种方法对于outlier非常敏感,因为outlier影响了max或min值,所以这种方法只适用于数据在一个范围内分布的情况。
RobustScaler
如果你的数据包含许多异常值,使用均值和方差缩放可能并不是一个很好的选择。这种情况下,你可以使用 robust_scale 以及 RobustScaler 作为替代品。它们对你的数据的中心和范围使用更有鲁棒性的估计。
This Scaler removes the median(中位数) and scales the data according to the quantile range(四分位距离,也就是说排除了outliers)
独热编码OneHotEncoder
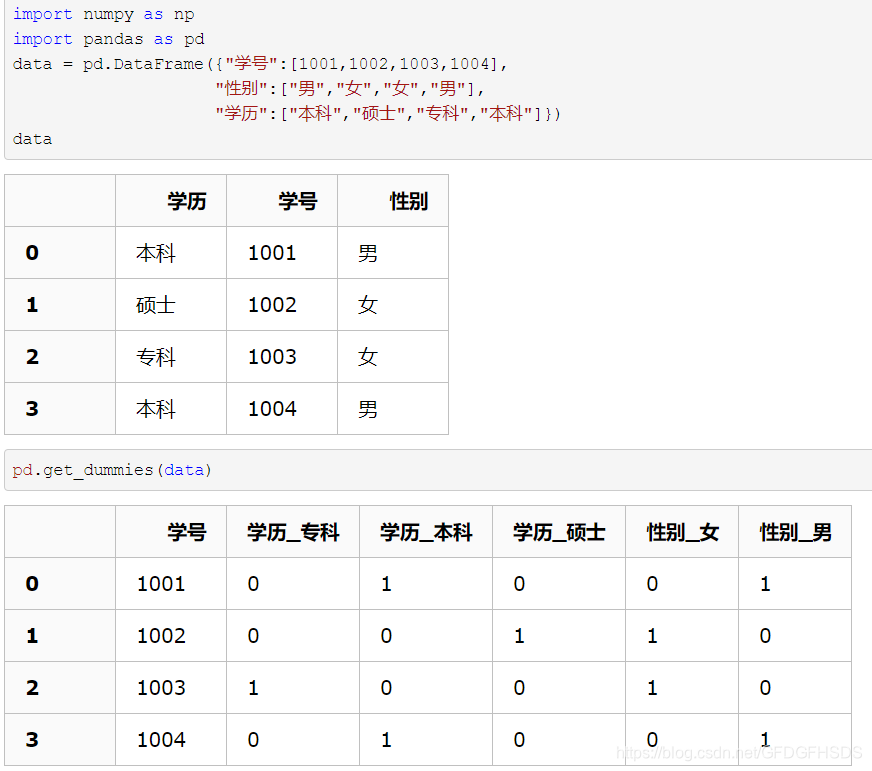
只能对表示分类的数字进行编码,输出跟get_dummies()一样,OneHotEncoder处理不了字符串。独热编码用来解决类别型数据的离散值问题,
from sklearn.preprocessing import OneHotEncoder
OHE = OneHotEncoder()
OHE.fit(data)
标准化到[0, 1] 还是 [-1, 1] 区间?
假设我们有一个只有一个hidden layer的多层感知机(MLP)的分类问题。每个hidden unit表示一个超平面,每个超平面是一个分类边界。参数w(weight)决定超平面的方向,参数b(bias)决定超平面离原点的距离。如果b是一些小的随机参数(事实上,b确实被初始化为很小的随机参数),那么所有的超平面都几乎穿过原点。所以,如果data没有中心化在原点周围,那么这个超平面可能没有穿过这些data,也就是说,这些data都在超平面的一侧。这样的话,局部极小点(local minima)很有可能出现。 所以,在这种情况下,标准化到[-1, 1]比[0, 1]更好。
1、在分类、聚类算法中,需要使用距离来度量相似性的时候、或者使用PCA技术进行降维的时候,StandardScaler表现更好。
2、在不涉及距离度量、协方差计算、数据不符合正太分布的时候,可以使用MinMaxScaler。比如图像处理中,将RGB图像转换为灰度图像后将其值限定在[0-255]的范围。原因是使用MinMaxScaler,其协方差产生了倍数值的缩放,因此这种方式无法消除量纲对方差、协方差的影响,对PCA分析影响巨大;同时,由于量纲的存在,使用不同的量纲、距离的计算结果会不同。
而在StandardScaler中,新的数据由于对方差进行了归一化,这时候每个维度的量纲其实已经等价了,每个维度都服从均值为0、方差1的正态分布,在计算距离的时候,每个维度都是去量纲化的,避免了不同量纲的选取对距离计算产生的巨大影响。
Jupyter的各种快捷键
执行当前cell,并自动跳到下一个cell:Shift+Enter

执行当前cell,执行后不自动调转到下一个cell:Ctrl+Enter

是当前的cell进入编辑模式:Enter

退出当前cell的编辑模式:Esc

删除当前的cell:双D

为当前的cell加入line number:单L

将当前的cell转化为具有一级标题的maskdown:单1

将当前的cell转化为具有二级标题的maskdown:单2

将当前的cell转化为具有三级标题的maskdown:单3

**为一行或者多行添加/取消注释:Crtl /**

撤销对某个cell的删除:z

浏览器的各个Tab之间切换:Crtl PgUp和Crtl PgDn
MaxAbsScaler
数据会被规模化到[-1,1]之间。也就是特征中,所有数据都会除以最大值。这个方法对那些已经中心化均值维0或者稀疏的数据有意义。
如果对稀疏数据进行去均值的中心化就会破坏稀疏的数据结构。虽然如此,我们也可以找到方法去对稀疏的输入数据进行转换,特别是那些特征之间的数据规模不一样的数据。MaxAbsScaler 和 maxabs_scale这两个方法是专门为稀疏数据的规模化所设计的。
正则化Normalization
x_normalized = preprocessing.normalize(x, norm='l2')
二值化Binarizer

## pd.get_dummies()
**用于将非数字变为独热编码,而数字不会处理**

## 标签编码LabelEncoder
用于将不连续的数字or文本进行编号,0,1,2,3。。。
```python
from sklearn.preprocessing import LabelEncoder
le = LabelEncoder()
le.fit([1,5,67,100])
le.transform([1,1,100,67,5])
#输出: array([0,0,3,2,1])
分箱编码
rom sklearn.preprocessing import KBinsDiscretizer
import numpy as np
# 创建一组特征数据,每一行表示一个样本,每一列表示一个特征
X = np.array([[1., -1., 2.],
              [2., 0., 0.],
              [0., 1., -1.]])
est = KBinsDiscretizer(n_bins=3, encode='ordinal', strategy='uniform')
est.fit_transform(X)
#array([[1., 0., 2.],
       [2., 1., 1.],
       [0., 2., 0.]])
#查看转换后分的箱:变成了一列中的三箱
set(est.fit_transform(X).ravel())
{0.0, 1.0, 2.0}
est = KBinsDiscretizer(n_bins=3, encode='onehot', strategy='uniform')
#查看转换后分的箱:变成了哑变量
est.fit_transform(X).toarray()
#array([[0., 1., 0., 1., 0., 0., 0., 0., 1.],
       [0., 0., 1., 0., 1., 0., 0., 1., 0.],
       [1., 0., 0., 0., 0., 1., 1., 0., 0.]])
reshape(1,-1)
先前我们不知道z的shape属性是多少,但是想让z变成只有一列,行数不知道多少,通过z.reshape(-1,1),Numpy自动计算出有12行,新的数组shape属性为(16, 1),与原来的(4, 4)配套。
z = np.array([[1, 2, 3, 4],
          [5, 6, 7, 8],
          [9, 10, 11, 12],
          [13, 14, 15, 16]])
z.shape
(4, 4)
z.reshape(-1)
array([ 1,  2,  3,  4,  5,  6,  7,  8,  9, 10, 11, 12, 13, 14, 15, 16])
z.reshape(-1, 1)
#也就是说,先前我们不知道z的shape属性是多少,但是想让z变成只有一列,行数不知道多少,通过`z.reshape(-1,1)`,Numpy自动计算出有12行,新的数组#shape属性为(16, 1),与原来的(4, 4)配套。
z.reshape(-1,1)
 array([[ 1],
        [ 2],
        [ 3],
        [ 4],
        [ 5],
        [ 6],
        [ 7],
        [ 8],
        [ 9],
        [10],
        [11],
        [12],
        [13],
        [14],
        [15],
        [16]])
z.reshape(-1, 2)
#newshape等于-1,列数等于2,行数未知,reshape后的shape等于(8, 2)
 z.reshape(-1, 2)
 array([[ 1,  2],
        [ 3,  4],
        [ 5,  6],
        [ 7,  8],
        [ 9, 10],
        [11, 12],
        [13, 14],
        [15, 16]])

#同理,只给定行数,newshape等于-1,Numpy也可以自动计算出新数组的列数。
弥补缺失数据Imputer
在scikit-learn的模型中都是假设输入的数据是数值型的,并且都是有意义的,如果有缺失数据是通过NAN,或者空值表示的话,就无法识别与计算了。要弥补缺失值,可以使用均值,中位数,众数等等。
#5 弥补缺失数据
在scikit-learn的模型中都是假设输入的数据是数值型的,并且都是有意义的,如果有缺失数据是通过NAN,或者空值表示的话,就无法识别与计算了。要弥补缺失值,可以使用均值,中位数,众数等等。Imputer这个类可以实现。请看:
import numpy as np
from sklearn.preprocessing import Imputer

imp = Imputer(missing_values='NaN', strategy='mean', axis=0)
imp.fit([[1, 2], [np.nan, 3], [7, 6]])

创建多项式特征
有的时候线性的特征并不能做出美的模型,于是我们会去尝试非线性。非线性是建立在将特征进行多项式地展开上的。
比如将两个特征 (X_1, X_2),它的平方展开式便转换成5个特征(1, X_1, X_2, X_1^2, X_1X_2, X_2^2). 代码案例如下:
# 6 创建多项式特征
# 有的时候线性的特征并不能做出美的模型,于是我们会去尝试非线性。非线性是建立在将特征进行多项式地展开上的。

import numpy as np
from sklearn.preprocessing import PolynomialFeatures

# 自建一组3*2的样本
x = np.arange(6).reshape(3, 2)
# 创建2次方的多项式
# 比如将两个特征 (X_1, X_2),它的平方展开式便转换成5个特征(1, X_1, X_2, X_1^2, X_1X_2, X_2^2). 代码案例如下:
poly = PolynomialFeatures(2)
poly.fit_transform(x)

交叉验证cross_val_score
from sklearn import datasets	#自带数据集
from sklearn.model_selection import train_test_split,cross_val_score	#划分数据 交叉验证
from sklearn.neighbors import KNeighborsClassifier  #一个简单的模型,只有K一个参数,类似K-means
import matplotlib.pyplot as plt
iris = datasets.load_iris()		#加载sklearn自带的数据集
X = iris.data 			#这是数据
y = iris.target 		#这是每个数据所对应的标签
train_X,test_X,train_y,test_y = train_test_split(X,y,test_size=1/3,random_state=3)	#这里划分数据以1/3的来划分 训练集训练结果 测试集测试结果
k_range = range(1,31)
cv_scores = []		#用来放每个模型的结果值
for n in k_range:
    knn = KNeighborsClassifier(n)   #knn模型,这里一个超参数可以做预测,当多个超参数时需要使用另一种方法GridSearchCV
    scores = cross_val_score(knn,train_X,train_y,cv=10,scoring='accuracy')  #cv:选择每次测试折数  accuracy:评价指标是准确度,可以省略使用默认值,具体使用参考下面。
    cv_scores.append(scores.mean())
plt.plot(k_range,cv_scores)
plt.xlabel('K')
plt.ylabel('Accuracy')		#通过图像选择最好的参数
plt.show()
best_knn = KNeighborsClassifier(n_neighbors=3)	# 选择最优的K=3传入模型
best_knn.fit(train_X,train_y)			#训练模型
print(best_knn.score(test_X,test_y))	#看看评分
最后得分为0.94

reval()
 1 from numpy import *
 2
 3 a = arange(12).reshape(3,4)
 4 print(a)
 5 # [[ 0  1  2  3]
 6 #  [ 4  5  6  7]
 7 #  [ 8  9 10 11]]
 8 print(a.ravel())
 9 # [ 0  1  2  3  4  5  6  7  8  9 10 11]
10 print(a.flatten())
11 # [ 0  1  2  3  4  5  6  7  8  9 10 11]
可以看到这两个函数实现的功能一样,但我们在平时使用的时候flatten()更为合适.在使用过程中flatten()分配了新的内存,但ravel()返回的是一个数组的视图.视图是数组的引用(说引用不太恰当,因为原数组和ravel()返回后的数组的地址并不一样)。
np.vstack()和np.hstack()
np.vstack():在竖直(verticla)方向上堆叠
np.hstack():在水平(horizontal)方向上平铺
import numpy as np
arr1=np.array([1,2,3])
arr2=np.array([4,5,6])
print np.vstack((arr1,arr2))

print np.hstack((arr1,arr2))

a1=np.array([[1,2],[3,4],[5,6]])
a2=np.array([[7,8],[9,10],[11,12]])
print a1
print a2
print np.hstack((a1,a2))
结果如下:
[[1 2 3]
 [4 5 6]]
[1 2 3 4 5 6]
[[1 2]
 [3 4]
 [5 6]]
[[ 7  8]
 [ 9 10]
 [11 12]]
[[ 1  2  7  8]
 [ 3  4  9 10]
 [ 5  6 11 12]]
忽略警告
import warnings
warnings.filterwarnings('ignore')
均方误差与cv交叉验证整合
def rmse_cv(model,X,y):
    rmse = np.sqrt(-cross_val_score(model, X, y, scoring="neg_mean_squared_error", cv=5))
    return rmse
网格搜索GridSearch
class grid():
    def __init__(self,model):
        self.model = model

    def grid_get(self,X,y,param_grid):
        grid_search = GridSearchCV(self.model,param_grid,cv=5, scoring="neg_mean_squared_error")
        grid_search.fit(X,y)
        print(grid_search.best_params_, np.sqrt(-grid_search.best_score_))
        grid_search.cv_results_['mean_test_score'] = np.sqrt(-grid_search.cv_results_['mean_test_score'])
        print(pd.DataFrame(grid_search.cv_results_)[['params','mean_test_score','std_test_score']])
集成模型ensemble
class AverageWeight(BaseEstimator, RegressorMixin):
    def __init__(self,mod,weight):
        self.mod = mod
        self.weight = weight

    def fit(self,X,y):
        self.models_ = [clone(x) for x in self.mod]
        for model in self.models_:
            model.fit(X,y)
        return self

    def predict(self,X):
        w = list()
        pred = np.array([model.predict(X) for model in self.models_])
        # for every data point, single model prediction times weight, then add them together
        for data in range(pred.shape[1]):
            single = [pred[model,data]*weight for model,weight in zip(range(pred.shape[0]),self.weight)]
            w.append(np.sum(single))
        return w
叠加模型stacking
class stacking(BaseEstimator, RegressorMixin, TransformerMixin):
    def __init__(self,mod,meta_model):
        self.mod = mod
        self.meta_model = meta_model
        self.kf = KFold(n_splits=5, random_state=42, shuffle=True)

    def fit(self,X,y):
        self.saved_model = [list() for i in self.mod]
        oof_train = np.zeros((X.shape[0], len(self.mod)))

        for i,model in enumerate(self.mod):
            for train_index, val_index in self.kf.split(X,y):
                renew_model = clone(model)
                renew_model.fit(X[train_index], y[train_index])
                self.saved_model[i].append(renew_model)
                oof_train[val_index,i] = renew_model.predict(X[val_index])

        self.meta_model.fit(oof_train,y)
        return self

    def predict(self,X):
        whole_test = np.column_stack([np.column_stack(model.predict(X) for model in single_model).mean(axis=1)
                                      for single_model in self.saved_model])
        return self.meta_model.predict(whole_test)

    def get_oof(self,X,y,test_X):
        oof = np.zeros((X.shape[0],len(self.mod)))
        test_single = np.zeros((test_X.shape[0],5))
        test_mean = np.zeros((test_X.shape[0],len(self.mod)))
        for i,model in enumerate(self.mod):
            for j, (train_index,val_index) in enumerate(self.kf.split(X,y)):
                clone_model = clone(model)
                clone_model.fit(X[train_index],y[train_index])
                oof[val_index,i] = clone_model.predict(X[val_index])
                test_single[:,j] = clone_model.predict(test_X)
            test_mean[:,i] = test_single.mean(axis=1)
        return oof, test_mean
pipe管道封装
#标签值标准化:[1,1,3,6,2]-> [0, 0, 2, 3, 1]
#也可以使非数字标签化,下面年份就是非数字
class labelenc(BaseEstimator, TransformerMixin):
    def __init__(self):
        pass

    def fit(self,X,y=None):
        return self

    def transform(self,X):
        lab=LabelEncoder()
        X["YearBuilt"] = lab.fit_transform(X["YearBuilt"])
        X["YearRemodAdd"] = lab.fit_transform(X["YearRemodAdd"])
        X["GarageYrBlt"] = lab.fit_transform(X["GarageYrBlt"])
        return X
class skew_dummies(BaseEstimator, TransformerMixin):
    def __init__(self,skew=0.5):
        self.skew = skew

    def fit(self,X,y=None):
        return self

    def transform(self,X):
        X_numeric=X.select_dtypes(exclude=["object"])
        skewness = X_numeric.apply(lambda x: skew(x))
        skewness_features = skewness[abs(skewness) >= self.skew].index
        X[skewness_features] = np.log1p(X[skewness_features])
        X = pd.get_dummies(X)
        return X
# build pipeline
pipe = Pipeline([
    ('labenc', labelenc()),
    ('skew_dummies', skew_dummies(skew=1)),
    ])
特征提取lasso
lasso=Lasso(alpha=0.001)
lasso.fit(X_scaled,y_log)
FI_lasso = pd.DataFrame({"Feature Importance":lasso.coef_}, index=data_pipe.columns)
FI_lasso.sort_values("Feature Importance",ascending=False)
FI_lasso[FI_lasso["Feature Importance"]!=0].sort_values("Feature Importance").plot(kind="barh",figsize=(15,25))
plt.xticks(rotation=90)
plt.show()
PCA降维
做PCA是非常重要的,这可以使得模型相对较大的提升。一开始我不相信PCA能帮到我,但现在回想起来,可能是因为我构建的特性高度相关,导致多重共线性。PCA可以解除这些特性的关联。所以我将在PCA中使用与原始数据中大致相同的维度。因为这里的目的不是降低维度。
pca = PCA(n_components=410)
#训练集fit+transform,测试只需要transform
X_scaled=pca.fit_transform(X_scaled)
test_X_scaled = pca.transform(test_X_scaled)
X_scaled.shape, test_X_scaled.shape
模型封装
models = [LinearRegression(),Ridge(),Lasso(alpha=0.01,max_iter=10000),RandomForestRegressor(),GradientBoostingRegressor(),SVR(),LinearSVR(),
          ElasticNet(alpha=0.001,max_iter=10000),SGDRegressor(max_iter=1000,tol=1e-3),BayesianRidge(),KernelRidge(alpha=0.6, kernel='polynomial', degree=2, coef0=2.5),
          ExtraTreesRegressor(),XGBRegressor()]
          names = ["LR", "Ridge", "Lasso", "RF", "GBR", "SVR", "LinSVR", "Ela","SGD","Bay","Ker","Extra","Xgb"]

for name, model in zip(names, models):
    score = rmse_cv(model, X_scaled, y_log)
    print("{}: {:.6f}, {:.4f}".format(name,score.mean(),score.std()))


 本文详细介绍数据预处理步骤,包括特征类型识别、缺失值处理、数据标准化、特征编码及模型选择技巧。涵盖预处理方法如log1p、expm1、StandardScaler、MinMaxScaler、RobustScaler和OneHotEncoder,以及模型评估与优化策略。


 1528
1528

 被折叠的 条评论
为什么被折叠?


