# Standard scientific Python imports
%matplotlib inline
import matplotlib.pyplot as plt
# Import datasets, classifiers and performance metricsfrom sklearn import datasets, svm, metrics
# The digits dataset
digits = datasets.load_digits()
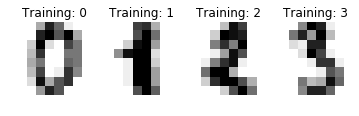
# The data that we are interested in is made of 8x8 images of digits, let's# have a look at the first 3 images, stored in the `images` attribute of the# dataset. If we were working from image files, we could load them using# pylab.imread. Note that each image must have the same size. For these# images, we know which digit they represent: it is given in the 'target' of# the dataset.
images_and_labels = list(zip(digits.images, digits.target))
for index, (image, label) in enumerate(images_and_labels[:4]):
plt.subplot(2, 4, index + 1)
plt.axis('off')
plt.imshow(image, cmap=plt.cm.gray_r, interpolation='nearest')
plt.title('Training: %i' % label)
# To apply a classifier on this data, we need to flatten the image, to# turn the data in a (samples, feature) matrix:
n_samples = len(digits.images)
data = digits.images.reshape((n_samples, -1))
Automatically created module for IPython interactive environment
n_samples
1797
data.shape
(1797, 64)
# Create a classifier: a support vector classifier
classifier = svm.SVC(gamma=0.001)
#train the modle
classifier.fit(data[:n_samples *2/3], digits.target[:n_samples*2/3])
#predict
expected = digits.target[n_samples *2/3:]
predicted = classifier.predict(data[n_samples*2/3:])
print("Classification report for classifier %s:\n%s\n"% (classifier, metrics.classification_report(expected, predicted)))
print("Confusion matrix:\n%s" % metrics.confusion_matrix(expected, predicted))
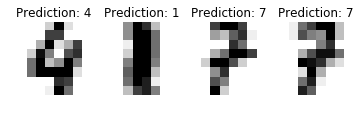
images_and_predictions = list(zip(digits.images[n_samples *2/3:], predicted))
for index, (image, prediction) in enumerate(images_and_predictions[:4]):
plt.subplot(2, 4, index + 5)
plt.axis('off')
plt.imshow(image, cmap=plt.cm.gray_r, interpolation='nearest')
plt.title('Prediction: %i' % prediction)
plt.show()
/usr/local/lib/python3.5/dist-packages/ipykernel/__main__.py:4: VisibleDeprecationWarning: using a non-integer number instead of an integer will result in an error in the future
/usr/local/lib/python3.5/dist-packages/ipykernel/__main__.py:7: VisibleDeprecationWarning: using a non-integer number instead of an integer will result in an error in the future
/usr/local/lib/python3.5/dist-packages/ipykernel/__main__.py:8: VisibleDeprecationWarning: using a non-integer number instead of an integer will result in an error in the future


Classification report for classifier SVC(C=1.0, cache_size=200, class_weight=None, coef0=0.0,
  decision_function_shape=None, degree=3, gamma=0.001, kernel='rbf',
  max_iter=-1, probability=False, random_state=None, shrinking=True,
  tol=0.001, verbose=False):
             precision    recall  f1-score   support

          0       1.00      0.98      0.99        59
          1       0.97      1.00      0.98        62
          2       1.00      0.98      0.99        60
          3       0.96      0.81      0.88        62
          4       0.98      0.95      0.97        62
          5       0.95      0.98      0.97        59
          6       0.98      0.98      0.98        61
          7       0.95      1.00      0.98        61
          8       0.89      0.98      0.93        55
          9       0.95      0.97      0.96        58

avg / total       0.96      0.96      0.96       599


Confusion matrix:
[[58  0  0  0  1  0  0  0  0  0]
 [ 0 62  0  0  0  0  0  0  0  0]
 [ 0  0 59  1  0  0  0  0  0  0]
 [ 0  0  0 50  0  2  0  3  7  0]
 [ 0  0  0  0 59  0  0  0  0  3]
 [ 0  0  0  0  0 58  1  0  0  0]
 [ 0  1  0  0  0  0 60  0  0  0]
 [ 0  0  0  0  0  0  0 61  0  0]
 [ 0  1  0  0  0  0  0  0 54  0]
 [ 0  0  0  1  0  1  0  0  0 56]]


/usr/local/lib/python3.5/dist-packages/ipykernel/__main__.py:13: VisibleDeprecationWarning: using a non-integer number instead of an integer will result in an error in the future
# Standard scientific Python imports%matplotlib inlineimport matplotlib.pyplot as plt# Import datasets, classifiers and performance metricsfrom sklearn import datasets, svm, metrics# The digits data


 477
477

 被折叠的 条评论
为什么被折叠?
被折叠的 条评论
为什么被折叠?
 到【灌水乐园】发言


