


k折交叉验证(k-fold Cross Validation)是常用的评估模型误差的办法,特别是对于规模中等大小的数据集。这种验证方法将原数据集分成规模相等的k份,其中每一份轮流作为验证集,剩余的k-1份作为训练集,循环k次后,用每一份上误差的平均值作为总的误差,以评估模型的准确性。当数据集非常小的时候,我们还可以采取留一法(Leave-One-Out Cross Validation)进行验证,即每次保留一个样本作为验证集,用其余个样本来训练模型。随着数据集的增加,交叉验证的计算成本也会显著增加。对于特别大的数据集,可能只采取3折交叉验证,甚至是2折交叉验证(即将数据集简单划分成训练集和测试集)。
k折交叉验证的实现
把一个数据集划分成k折,本质上就是将索引划分成k折,并且这种划分应该满足随机性。把把样本集划分为k折可以采取如下的步骤:
1. 计算每一个折的样本容量。
2. 从原始索引集中循环采样,获得每一折的索引。
3. 根据每一折的索引从原数据集中取数据。
这里需要考虑的主要有两个问题,第一,样本容量不能整除折数k时如何分折,第二,如何从原始数据集中不放回地抽取子索引。
以下是实现上述过程的Python代码,其中给出了一种随机不均分k折的计算方法。
(函数没有抛出错误类型,而是简单打印错误原因,并返回一个负数,有需要可以自行修改)
## 创建切分索引函数
def kIndexCut(n,k):
    if k <= n:
        origin_index = np.arange(n)

        # 指定每次想要抽取的样本数
        sample_size = calculateSampleSizes(n,k)

        # 我们打算进行k轮抽样
        num_rounds = k
        index_cut = np.zeros(k).tolist()
        for i in range(num_rounds):
            # 进行不放回抽样
            sample = np.random.choice(origin_index, size=int(sample_size[i]), replace=False)
            # print(f"第 {i+1} 轮抽取的样本: {sample}")
            index_cut[i] = sample
            # 更新数据池,移除已经抽取过的元素
            # 这确保了下一轮抽样不会重复抽到相同的元素
            origin_index = renewIndex(origin_index, sample)
        return index_cut

    else:
        print("折数大于样本数,重新选择折数")
        return -1

## 更新索引池
def renewIndex(origin_index,sample):
    origin_index = origin_index[np.logical_not(np.isin(origin_index, sample))]
    return origin_index

# 计算每一折容量的函数
# 当k不能整除n时,我们有如下算法(整除也适用,因为余数0.0 < 0.5)
# 记n/k的小数部分为 f
# 如果f=0.5,则需要有一半采取商的天花板,其余采取的地板
# 如果f<0.5,则需要有n mod k 折采取天花板,其余采取地板
# 如果f>0.5,则需要有k - n mod k 折采取地板,其余采取天花板
def calculateSampleSizes(n,k):
    if not isinstance(n, int) or not isinstance(k, int):
        print("请保证n,k为整数")
        return -1
    else:
        sample_size = np.zeros(k)
        fraction, intger = np.modf(1. * n/(1. * k))
        if(fraction == 0.5):
            sample_size[:] = intger + 1
            random_integers = np.random.choice(k, size=(int(k/2)),replace=False)
            sample_size[random_integers] = intger
        elif(fraction > 0.5):
            sample_size[:] = intger+1
            random_integers = np.random.choice(k, size=(k - n % k),replace=False)
            sample_size[random_integers] = intger
        elif(fraction < 0.5):
            sample_size[:] = intger
            random_integers = np.random.choice(k, size=(n % k), replace=False)
            sample_size[random_integers] = intger+1

        if int(sum(sample_size)) == n:
            return sample_size
        else:
            s = sum(sample_size)
            print(f"不等长的位置为{random_integers},各折总数为{s},分折出现问题")
            return -2

def kFold2(sample,k,random_seed):
    np.random.seed(random_seed) #设置随机数种子
    N = sample.shape[0]
    sample_cut = np.zeros(k).tolist()
    index_cut = kIndexCut(N,k)
    for i in range(k):
        sample_cut[i] = sample[np.array(index_cut[i])]
    return sample_cut
我们可以用一个示例来测试上述代码
#以下是一个实例
def gen_multivar_normal(mean,cov,n):
# assert isinstance(cov, (list, np.ndarray)) and len(cov) == len(mean)
# assert all(len(row) == len(mean) for row in cov)
#these two command are inserted to make sure the input parameter
#having appropriate type and dimension,if not holds,
#return error
samples = np.random.multivariate_normal(mean, cov, n)
return samples
mean = np.array([1,1])
cov = np.array([[1,0],[0,1]])
n = 100
samples = gen_multivar_normal(mean,cov,n)
mean1 = np.array([-1,-1])
cov1 = np.array([[0.5,0],[0,0.5]])
n1 = 100
samples1 = gen_multivar_normal(mean1,cov1,n1)
x1 = np.zeros((100,3))
x2 = np.zeros((100,3))
x1[:,0] = samples[:,0]
x1[:,1] = samples[:,1]
x1[:,2] = 0
x2[:,0] = samples1[:,0]
x2[:,1] = samples1[:,1]
x2[:,2] = 1
x = np.vstack((x1,x2))
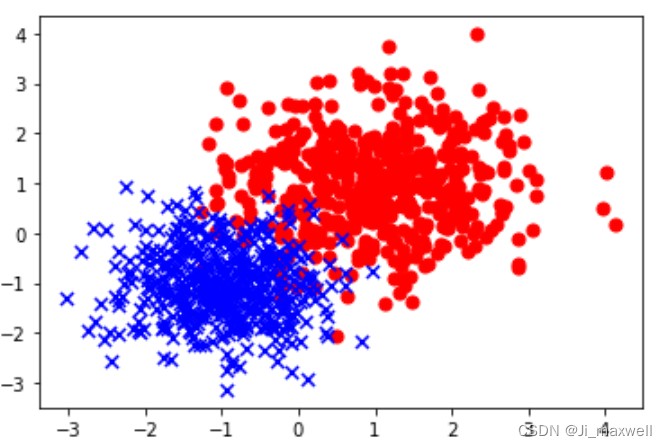
categories = {
0: ('red', 'o'), # 分类 0:红色,圆圈标记
1: ('blue', 'x'), # 分类 1:蓝色,叉号标记
# ... (如果有更多分类,可以在这里添加)
}
fig, ax = plt.subplots()
# 遍历数据中的每个点
for x1, y1, category in x:
# 根据第三列的值选择颜色和标记
color, marker = categories[category]
# 绘制点
ax.scatter(x1, y1, c=color, marker=marker, s=50) # s 是点的大小我们可以画出两类点的分布:
将原数据集分成10折,取第一折
fold1_of_x = kFold2(x,10,random_seed = 1234)[0]我们再画出来看看
for x2, y2, category in fold1_of_x:
    # 根据第三列的值选择颜色和标记
    color, marker = categories[category]

    # 绘制点
    plt.scatter(x2, y2, c=color, marker=marker, s=50)  # s 是点的大小
好啦这就是本文的全部内容,分折的时间还是比较快的(画图比较慢),读者可用较大的数据集测试。第一次发布文章,有不当之处请多多指教!


 7185
7185


 被折叠的 条评论
为什么被折叠?
被折叠的 条评论
为什么被折叠?
 到【灌水乐园】发言


