


Python-Matplotlib可视化(番外篇)——Matplotlib中的事件处理详解与实战
前言
在博文《OpenCV-Python实战(番外篇)——OpenCV中利用鼠标事件动态绘制图形》中,介绍了 OpenCV 中的事件处理,并利用其进行图形的动态绘制。那么 Matplotlib 作为 Python 的绘图库,能否直接进行事件处理呢?答案是肯定的。作为对《Python-Matplotlib可视化》系列的补充,本文将介绍在 Matplotlib 中事件的处理。
Matplotlib 与许多用户界面工具包配合使用,包括 wxpython、tkinter、qt 以及gtk 等,因此不必针对不同的用户界面编写功能重复的代码。Matplotlib与标准 GUI 事件相比,触发的事件更丰富,其包括事件发生在哪个轴等信息。
事件连接
要使 Matplotlib 可以接收事件,需要编写一个回调函数(在事件发生时会进行调用),然后将函数连接到事件管理器。
以鼠标事件为例,我们通过以下程序实现打印鼠标点击的位置和按下了哪个按钮的功能:
from matplotlib import pyplot as plt
import numpy as np

fig, ax = plt.subplots()
ax.scatter(np.random.rand(100), np.random.rand(100))

# 编写回调函数
def onclick(event):
    print('%s click: button=%d, x=%d, y=%d, xdata=%f, ydata=%f' %
          ('double' if event.dblclick else 'single', event.button,
           event.x, event.y, event.xdata, event.ydata))

# 将回调函数连接到事件管理器上
cid = fig.canvas.mpl_connect('button_press_event', onclick)

plt.show()
FigureCanvasBase.mpl_connect 方法返回该事件的连接 id,此 id 可用于断开回调:
fig.canvas.mpl_disconnect(cid)
可以使用 Matplotlib 连接更多事件,具体参见官方文档,在此不在一一列举。需要注意的是,连接到“key_press_event”和“key_release_event”事件时,Matplotlib 使用不同用户界面工具包之间可能会出现不一致。可以通过查看键盘快捷键,可以看到 Matplotlib 默认附加了一些按键回调。
事件属性
所有 Matplotlib 事件都继承自基类 matplotlib.backend_bases.Event,它包含以下属性:
| 属性名 | 含义 |
|---|---|
| name | 事件名 |
| canvas | FigureCanvas 实例生成事件 |
| guiEvent | 触发 Matplotlib 事件的GUI事件 |
我们以事件处理中最常见的事件 按键按下/释放事件 和 鼠标按下/释放/移动事件 为例,利用事件属性。 处理这些事件的 KeyEvent 和 MouseEvent 类都是从 LocationEvent 派生的,它具有以下属性:
| 属性名 | 含义 |
|---|---|
| x,y | 鼠标距画布左下角的距离(以像素为单位) |
| inaxes | 鼠标所在的 Axes 实例(如果有) |
| xdata, ydata | 鼠标在数据坐标中的位置 |
为了对比属性 x、y 和 xdata、ydata 的区别,使用以下程序进行说明,此程序会在鼠标单击时,在画布上显示鼠标事件的 x、y、xdata、和 ydata 属性:
from matplotlib import pyplot as plt

class TextBuilder:
    def __init__(self, line):
        self.text = text
        self.content = self.text.get_text()
        self.cid = text.figure.canvas.mpl_connect('button_press_event', self)

    def __call__(self, event):
        print('click', event)
        if event.inaxes!=self.text.axes: return
        self.text.set_x(event.xdata)
        self.text.set_y(event.ydata)
        self.text.set_text('x:{},y:{},xdata:{:.2f},ydata:{:.2f}'.format(event.x,event.y,event.xdata,event.ydata))
        self.text.figure.canvas.draw()

fig, ax = plt.subplots()
ax.set_title('click to show event attribute')
text = plt.text([0], [0], '')
textbuilder = TextBuilder(text)

plt.show()
运行程序后,当在画布上单击时,会在鼠标点击处,绘制出事件的 x、y、xdata、和 ydata 属性值:
 接下来,我们编写另一个示例程序,此程序会在每次按下鼠标时绘制一条线段:
from matplotlib import pyplot as plt

class LineBuilder:
    def __init__(self, line):
        self.line = line
        self.xs = list(line.get_xdata())
        self.ys = list(line.get_ydata())
        self.cid = line.figure.canvas.mpl_connect('button_press_event', self)

    def __call__(self, event):
        print('click', event)
        if event.inaxes!=self.line.axes: return
        self.xs.append(event.xdata)
        self.ys.append(event.ydata)
        self.line.set_data(self.xs, self.ys)
        self.line.figure.canvas.draw()

fig, ax = plt.subplots()
ax.set_title('click to build line segments')
line, = ax.plot([0], [0])  # empty line
linebuilder = LineBuilder(line)

plt.show()
运行程序后,当在画布上单击时,会在每次按下鼠标时绘制一条线段:

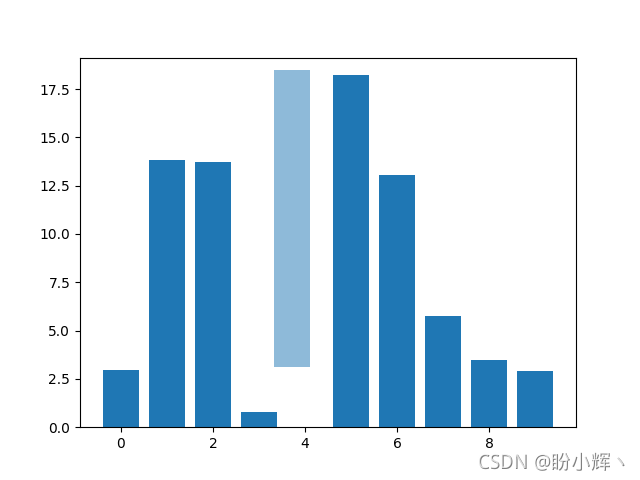
实战1:直方图中矩形的拖拽
接下来,为了更好的理解 Matplotlib 中的事件,编写使用 Rectangle 实例初始化的可拖动矩形类,在拖动时同时移动矩形位置。
在拖拽前,需要存储矩形的原始位置,该位置存储可以使用 rect.xy 获得,然后需要连接按下(press)、运动(motion)和释放(release)鼠标事件。 当按下鼠标时,检查单击是否发生在矩形上,如果是,则将矩形位置和鼠标单击的位置存储在数据坐标中。 在运动事件回调中,计算鼠标移动的距离 deltax 和 deltay,并利用这些值计算矩形新的位置,设置矩形透明度,最后重绘图。在鼠标释放事件中,需要将存储的数据重置为 None,并恢复矩形透明度:
import numpy as np
import matplotlib.pyplot as plt

class DraggableRectangle:
    def __init__(self, rect):
        self.rect = rect
        self.press = None

    def connect(self):
        """Connect to all the events we need."""
        self.cidpress = self.rect.figure.canvas.mpl_connect(
            'button_press_event', self.on_press)
        self.cidrelease = self.rect.figure.canvas.mpl_connect(
            'button_release_event', self.on_release)
        self.cidmotion = self.rect.figure.canvas.mpl_connect(
            'motion_notify_event', self.on_motion)

    def on_press(self, event):
        """Check whether mouse is over us; if so, store some data."""
        if event.inaxes != self.rect.axes:
            return
        contains, attrd = self.rect.contains(event)
        if not contains:
            return
        print('event contains', self.rect.xy)
        self.press = self.rect.xy, (event.xdata, event.ydata)

    def on_motion(self, event):
        """Move the rectangle if the mouse is over us."""
        if self.press is None or event.inaxes != self.rect.axes:
            return
        (x0, y0), (xpress, ypress) = self.press
        dx = event.xdata - xpress
        dy = event.ydata - ypress
        self.rect.set_x(x0+dx)
        self.rect.set_y(y0+dy)
        self.rect.set_alpha(0.5)
        self.rect.figure.canvas.draw()

    def on_release(self, event):
        """Clear button press information."""
        self.press = None
        self.rect.set_alpha(1.)
        self.rect.figure.canvas.draw()

    def disconnect(self):
        """Disconnect all callbacks."""
        self.rect.figure.canvas.mpl_disconnect(self.cidpress)
        self.rect.figure.canvas.mpl_disconnect(self.cidrelease)
        self.rect.figure.canvas.mpl_disconnect(self.cidmotion)

fig, ax = plt.subplots()
rects = ax.bar(range(10), 20*np.random.rand(10))
drs = []
for rect in rects:
    dr = DraggableRectangle(rect)
    dr.connect()
    drs.append(dr)

plt.show()
运行程序后,可以在画布上使用鼠标拖拽矩形,并且在拖拽过程中矩形透明度会降低以显式显示正在拖拽的矩形:
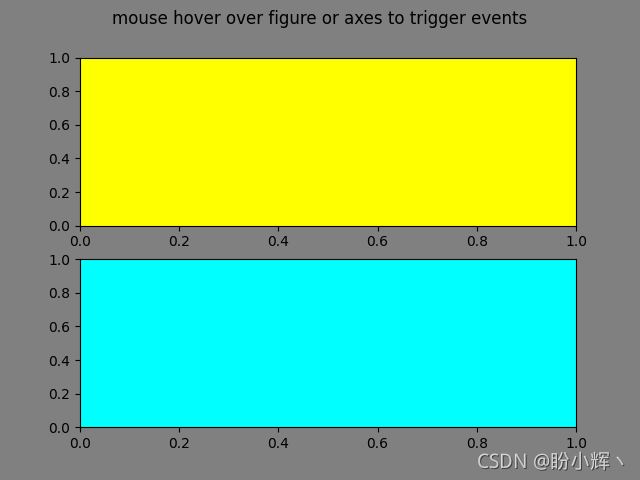
实战2:鼠标进入和离开
如果想在鼠标进入或离开图形或轴时收到通知,可以连接图形或轴的进入或离开事件:
import matplotlib.pyplot as plt

def enter_axes(event):
    print('enter_axes', event.inaxes)
    event.inaxes.patch.set_facecolor('yellow')
    event.canvas.draw()

def leave_axes(event):
    print('leave_axes', event.inaxes)
    event.inaxes.patch.set_facecolor('cyan')
    event.canvas.draw()

def enter_figure(event):
    print('enter_figure', event.canvas.figure)
    event.canvas.figure.patch.set_facecolor('red')
    event.canvas.draw()

def leave_figure(event):
    print('leave_figure', event.canvas.figure)
    event.canvas.figure.patch.set_facecolor('grey')
    event.canvas.draw()

fig, axs = plt.subplots(2)
fig.suptitle('mouse hover over figure or axes to trigger events')

fig.canvas.mpl_connect('figure_enter_event', enter_figure)
fig.canvas.mpl_connect('figure_leave_event', leave_figure)
fig.canvas.mpl_connect('axes_enter_event', enter_axes)
fig.canvas.mpl_connect('axes_leave_event', leave_axes)

plt.show()


 3163
3163


 被折叠的 条评论
为什么被折叠?
被折叠的 条评论
为什么被折叠?
 到【灌水乐园】发言


