Three White Soldiers
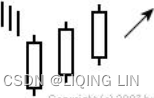
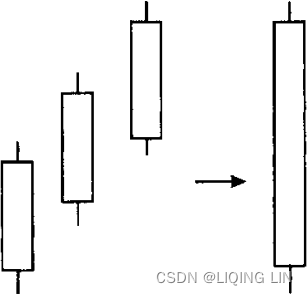
The Three White Soldiers pattern reduces to a very bullish long white candle line. This breakdown is in full support of the pattern, which makes confirmation unnecessary.
Behavior and Rank
- Theoretical: Bullish reversal.
- Actual bull market: Bullish reversal 82% of the time (ranking 3).
- Actual bear market: Bullish reversal 84% of the time (ranking 3).
- Frequency: 67th out of 103.
- Overall performance over time: 32nd out of 103.
- Number of candle lines : Three.
- Price trend : Downward leading to the start of the candle pattern.
- Three days : Tall white candles with higher closes and price that opens within the previous body. Price should close near the high each day.
- The opening prices of the second and third days can be anywhere within the previous body.
However, it is better to see the open above the midpoint of the previous day’s body- However, there should be no gaps between candles—each candle opens within the body of the one preceding it.
为了使该形态被认为是有效的,每根蜡烛应该直接跟随前一根蜡烛,中间没有任何明显的gap。 没有缺口有助于强调该模式的动力和强度,表明市场情绪从看跌转向看涨的决定性转变。
如果三白兵形态中的任何一根蜡烛之间存在gap,就会削弱该形态的重要性,并可能暗示较弱的看涨反转信号。
- However, there should be no gaps between candles—each candle opens within the body of the one preceding it.
- except the doji and the spinning tops
- I have found that on corrections, the first or second white candle that started the three white soldiers is often support.
- The opening prices of the second and third days can be anywhere within the previous body.
Three white soldiers is a bullish reversal candle that appears in a downward price trend. The high reversal rate in a bull market, 82%, is possible because price closes near the top of the candle pattern. Another price bar(the forth day), one that closes above the top, confirms the pattern as a reversal. That’s much easier to do than price backtracking/ˈbæktræk/回溯,由原路返回 all the way down and closing below the candle’s low.另一个价格柱(第四天),收盘价高于顶部,确认了反转模式。 这比价格一路回落并收于蜡烛低点下方要容易得多。
The psychology behind the pattern is all about the bulls taking control of the stock. In a downward price trend with the bears forcing price lower, the bulls are police with batons/bəˈtɑːn/接力棒,警棍 at the ready, halting/ hɔːlt /阻止,中断 a riot/ˈraɪət/暴乱,骚乱. Day after day, price closes higher as the bulls push the bears back until there are few bears left in the march/mɑːrtʃ/游行示威. The candle series is tall enough that its upward price movement creates its own bullish excitement, a microclimate/ˈmaɪkroʊklaɪmət/小气候 that feeds on itself自我滋养. The performance numbers suggest that price will continue higher after the candle pattern ends.
splitted stock : ABT
stock_symbol='ABT'
start_date='2004-09-01'
new_start_date = pd.to_datetime('2003-11-14')
new_end_date = '2004-12-15'
df = yf.download( stock_symbol, start=new_start_date, end=new_end_date)
df['Open_Close_mean']=(df['Open']+df['Close'])/2.
#df[['Open', 'High', 'Low','Close', 'Open_Close_mean']]
######################since GILD stock split
if stock_symbol=='GILD':
df.loc[:,
['Open', 'High', 'Low','Close', 'Open_Close_mean','Adj Close']
]=df.loc[:,['Open', 'High', 'Low','Close', 'Open_Close_mean','Adj Close']]*4
elif stock_symbol=='ABT' and start_date=='2004-09-01':
df.loc[:,
['Open', 'High', 'Low','Close', 'Open_Close_mean','Adj Close']
]=df.loc[:,['Open', 'High', 'Low','Close', 'Open_Close_mean','Adj Close']]*2.0842017507295
ma_d_c={'5':'blue', '10':'green', '15':'magenta', '20':'black', '50':'purple', '200': 'red'}
sma_ema='sma' #'ema'
# Exponential Moving Average
for d in ma_d_c.keys():
if sma_ema =='sma': # Simple Moving Average
df['{}_{}d'.format(sma_ema, d)] = df['Close'].rolling( int(d) ).mean()
elif sma_ema == 'ema': # Exponential Moving Average
df['{}_{}d'.format(sma_ema, d)] = df['Close'].ewm( ignore_na=False,
span=int(d), ###
min_periods=0,
adjust=True
).mean()
else:
pass
sma_ema='ema' #'ema'
# Exponential Moving Average
for d in ma_d_c.keys():
if sma_ema =='sma': # Simple Moving Average
df['{}_{}d'.format(sma_ema, d)] = df['Close'].rolling( int(d) ).mean()
elif sma_ema == 'ema': # Exponential Moving Average
df['{}_{}d'.format(sma_ema, d)] = df['Close'].ewm( ignore_na=False,
span=int(d), ###
min_periods=0,
adjust=True
).mean()
else:
pass
# df=df.loc['2001-04-02':new_end_date] # new_end_date = '2001-08-02'
#df=df.loc['2006-08-01':new_end_date] # new_end_date = '2001-08-02'
print(stock_symbol)
df=df.loc[start_date:new_end_date]
df
...
2004-10-26 ,BullishEngulfing,BullishOutsideDay 2004-10-27 OpeningMarubozu,BullishBeltHold,3OutsideUp 2004-10-28 ,3WhiteSoldiers 2004-10-29 SpinningTop,DescendingHawk,TweezersTop 2004-11-01 ShortCandle
Figure 92.1 shows an example of three white soldiers(2004-10-26,2004-10-27,2004-10-28) converting a downward price trend into an upward one. The short-term trend begins either at A in October or back in mid-September, depending on your perspective and whether you’re using reading glasses. It ends at B. Bullish buying grips/ɡrɪps/握紧,抓住 the stock where the smart money knows the price is oversold. Their buying pressure is a rocket propelling/prəˈpelɪŋ/推动 the stock higher. Three white candles post higher closes; then price pauses for several days before the climb resumes.
Figure 92.1 Three white soldiers appear at the end of a downward move.
stock : EGN
stock_symbol='EGN'# https://www.investing.com/equities/energen-corp-historical-data
start_date='2000-04-01'
new_start_date = pd.to_datetime('19990614')
new_end_date = '20000801'
df = pd.read_csv(stock_symbol + \
str(new_start_date.year).zfill(4) + str(new_start_date.month).zfill(2) + str(new_start_date.day).zfill(2) + \
'_{}.csv'.format(new_end_date),
index_col='Date', parse_dates=['Date'],
#dtype={'Price':'np.float64', 'Open':'np.float64', 'High':np.float64, 'Low':np.float64}
#dtype={'Vol.':int}
)
df.rename(columns={'Price':'Close', 'Vol.':'Volume'}, inplace=True)
def value_to_float(x):
if type(x) == float or type(x) == int:
return x
if 'K' in x:
if len(x) > 1:
return float(x.replace('K', '')) * 1000
return 1000.0
if 'M' in x:
if len(x) > 1:
return float(x.replace('M', '')) * 1000000
return 1000000.0
if 'B' in x:
return float(x.replace('B', '')) * 1000000000
return 0.0
df['Volume'] = df['Volume'].apply(value_to_float)
df['Open_Close_mean']=(df['Open']+df['Close'])/2.
df['Adj Close']=df['Close']#########
# only for tso stock
df=df[['Open', 'High', 'Low','Close', 'Adj Close','Volume','Open_Close_mean']]
df.sort_index(inplace=True)
ma_d_c={'5':'blue', '10':'green', '15':'magenta', '20':'black', '50':'purple', '200': 'red'}
sma_ema='sma' #'ema'
# Exponential Moving Average
for d in ma_d_c.keys():
if sma_ema =='sma': # Simple Moving Average
df['{}_{}d'.format(sma_ema, d)] = df['Close'].rolling( int(d) ).mean()
elif sma_ema == 'ema': # Exponential Moving Average
df['{}_{}d'.format(sma_ema, d)] = df['Close'].ewm( ignore_na=False,
span=int(d), ###
min_periods=0,
adjust=True
).mean()
else:
pass
sma_ema='ema' #'ema'
# Exponential Moving Average
for d in ma_d_c.keys():
if sma_ema =='sma': # Simple Moving Average
df['{}_{}d'.format(sma_ema, d)] = df['Close'].rolling( int(d) ).mean()
elif sma_ema == 'ema': # Exponential Moving Average
df['{}_{}d'.format(sma_ema, d)] = df['Close'].ewm( ignore_na=False,
span=int(d), ###
min_periods=0,
adjust=True
).mean()
else:
pass
print(stock_symbol)
df=df.loc[start_date:new_end_date]# 'UNTD'
df
...
2000-06-22 Marubozu
2000-06-23 ,PiercingPattern
2000-06-26 OpeningMarubozu,BullishBeltHold
2000-06-27 Marubozu,3WhiteSoldiers
2000-06-28 ClosingMarubozu,3WhiteSoldiers
2000-06-29 Marubozu,RisingWindow
Figure 92.2 shows another example of the three white soldiers(2000-06-23,2000-06-26,2000-06-27) candle, this one central to a trade that Ashley made.
Price broke out of a long congestion region with an uptrend beginning at A and rising quickly to B. It then retraced a good portion of the climb回撤了大部分上涨趋势 by falling to C. That point was at the bottom of the tall white candle, which is a common support region (as is anywhere within an unusually tall white body). It was also the point of a 62% Fibonacci retracement of the AB rise.
Ashley waited for price to recover from this drop. When the three white soldiers(2000-06-23,2000-06-26,2000-06-27) completed, that was the buy signal she was waiting for. She bought the stock the next day(2000-06-28) at the open.
Figure 92.2 Three white soldiers appear at the 62% Fibonacci retracement value.
stock : HON
stock_symbol='HON'
start_date='2008-01-30'
new_start_date = pd.to_datetime('2007-04-17')
new_end_date = '2008-04-02'
df = yf.download( stock_symbol, start=new_start_date, end=new_end_date)
df['Open_Close_mean']=(df['Open']+df['Close'])/2.
#df[['Open', 'High', 'Low','Close', 'Open_Close_mean']]
ma_d_c={'5':'blue', '10':'green', '15':'magenta', '20':'black', '50':'purple', '200': 'red'}
sma_ema='sma' #'ema'
# Exponential Moving Average
for d in ma_d_c.keys():
if sma_ema =='sma': # Simple Moving Average
df['{}_{}d'.format(sma_ema, d)] = df['Close'].rolling( int(d) ).mean()
elif sma_ema == 'ema': # Exponential Moving Average
df['{}_{}d'.format(sma_ema, d)] = df['Close'].ewm( ignore_na=False,
span=int(d), ###
min_periods=0,
adjust=True
).mean()
else:
pass
sma_ema='ema' #'ema'
# Exponential Moving Average
for d in ma_d_c.keys():
if sma_ema =='sma': # Simple Moving Average
df['{}_{}d'.format(sma_ema, d)] = df['Close'].rolling( int(d) ).mean()
elif sma_ema == 'ema': # Exponential Moving Average
df['{}_{}d'.format(sma_ema, d)] = df['Close'].ewm( ignore_na=False,
span=int(d), ###
min_periods=0,
adjust=True
).mean()
else:
pass
# df=df.loc['2001-04-02':new_end_date] # new_end_date = '2001-08-02'
#df=df.loc['2006-08-01':new_end_date] # new_end_date = '2001-08-02'
print(stock_symbol)
df=df.loc[start_date:new_end_date]
df
...
2008-02-19 InvertedHammer1 2008-02-20 Hammer 2008-02-21 ,LastEngulfingBottom 2008-02-22 ShortCandle 2008-02-26 OpeningMarubozu,3WhiteSoldiers 2008-02-27 ShortCandle,BearishDeliberation 2008-02-28 HighWave,DescendingHawk 2008-02-29 ,FallingWindow
Circled in red is the three white soldiers candlestick pattern. Each of the three candles is white, tall, opens within the body of the prior candle and closes higher, with a short upper shadow (meaning each white candle closes near the high).
Price continues rising for a fourth day(2008-02-27) before tumbling. Although the breakout from this three white soldiers is upward, you can see how the trend quickly reverses. A short move after an upward breakout is typical for this pattern. And the breakout is a close either above the high or below the low of the three line pattern突破是收盘价高于三线形态的高点或低于三线形态的低点.
This is an example of the three white soldiers appearing as a retrace in a primary down trend (see Three Trading Tidbits/ˈtɪdbɪts/小花絮,花边新闻, above). After the retrace completes, the downward price trend resumes.
stock : MXIM
stock_symbol='MXIM'# https://www.investing.com/equities/maxim-integrated-historical-data
start_date='1996-03-25'
new_start_date = pd.to_datetime('19950605')
new_end_date = '19960601'
df = pd.read_csv(stock_symbol + \
str(new_start_date.year).zfill(4) + str(new_start_date.month).zfill(2) + str(new_start_date.day).zfill(2) + \
'_{}.csv'.format(new_end_date),
index_col='Date', parse_dates=['Date'],
#dtype={'Price':'np.float64', 'Open':'np.float64', 'High':np.float64, 'Low':np.float64}
#dtype={'Vol.':int}
)
df.rename(columns={'Price':'Close', 'Vol.':'Volume'}, inplace=True)
def value_to_float(x):
if type(x) == float or type(x) == int:
return x
if 'K' in x:
if len(x) > 1:
return float(x.replace('K', '')) * 1000
return 1000.0
if 'M' in x:
if len(x) > 1:
return float(x.replace('M', '')) * 1000000
return 1000000.0
if 'B' in x:
return float(x.replace('B', '')) * 1000000000
return 0.0
df['Volume'] = df['Volume'].apply(value_to_float)
df['Open_Close_mean']=(df['Open']+df['Close'])/2.
df['Adj Close']=df['Close']#########
# only for tso stock
df=df[['Open', 'High', 'Low','Close', 'Adj Close','Volume','Open_Close_mean']]
df.sort_index(inplace=True)
ma_d_c={'5':'blue', '10':'green', '15':'magenta', '20':'black', '50':'purple', '200': 'red'}
sma_ema='sma' #'ema'
# Exponential Moving Average
for d in ma_d_c.keys():
if sma_ema =='sma': # Simple Moving Average
df['{}_{}d'.format(sma_ema, d)] = df['Close'].rolling( int(d) ).mean()
elif sma_ema == 'ema': # Exponential Moving Average
df['{}_{}d'.format(sma_ema, d)] = df['Close'].ewm( ignore_na=False,
span=int(d), ###
min_periods=0,
adjust=True
).mean()
else:
pass
sma_ema='ema' #'ema'
# Exponential Moving Average
for d in ma_d_c.keys():
if sma_ema =='sma': # Simple Moving Average
df['{}_{}d'.format(sma_ema, d)] = df['Close'].rolling( int(d) ).mean()
elif sma_ema == 'ema': # Exponential Moving Average
df['{}_{}d'.format(sma_ema, d)] = df['Close'].ewm( ignore_na=False,
span=int(d), ###
min_periods=0,
adjust=True
).mean()
else:
pass
print(stock_symbol)
df=df.loc[start_date:new_end_date]# 'UNTD'
df
...
1996-04-17 InvertedHammer2,FallingWindow
1996-04-18 InvertedHammer1
1996-04-22 OpeningMarubozu,BullishBeltHold
1996-04-23 ,3WhiteSoldiers
1996-04-24 ShootingStar2,BearishMeetingLine
splitted stock : HPQ : 1WhiteSoldier
stock_symbol='HPQ'
start_date='2005-03-07'
new_start_date = pd.to_datetime('2004-05-20')
new_end_date = '2005-07-27'
df = yf.download( stock_symbol, start=new_start_date, end=new_end_date)
df['Open_Close_mean']=(df['Open']+df['Close'])/2.
#df[['Open', 'High', 'Low','Close', 'Open_Close_mean']]
######################since GILD stock split
if stock_symbol=='GILD':
df.loc[:,
['Open', 'High', 'Low','Close', 'Open_Close_mean','Adj Close']
]=df.loc[:,['Open', 'High', 'Low','Close', 'Open_Close_mean','Adj Close']]*4
elif stock_symbol=='HPQ':
df.loc[:,
['Open', 'High', 'Low','Close', 'Open_Close_mean','Adj Close']
]=df.loc[:,['Open', 'High', 'Low','Close', 'Open_Close_mean','Adj Close']]*2.202
ma_d_c={'5':'blue', '10':'green', '15':'magenta', '20':'black', '50':'purple', '200': 'red'}
sma_ema='sma' #'ema'
# Exponential Moving Average
for d in ma_d_c.keys():
if sma_ema =='sma': # Simple Moving Average
df['{}_{}d'.format(sma_ema, d)] = df['Close'].rolling( int(d) ).mean()
elif sma_ema == 'ema': # Exponential Moving Average
df['{}_{}d'.format(sma_ema, d)] = df['Close'].ewm( ignore_na=False,
span=int(d), ###
min_periods=0,
adjust=True
).mean()
else:
pass
sma_ema='ema' #'ema'
# Exponential Moving Average
for d in ma_d_c.keys():
if sma_ema =='sma': # Simple Moving Average
df['{}_{}d'.format(sma_ema, d)] = df['Close'].rolling( int(d) ).mean()
elif sma_ema == 'ema': # Exponential Moving Average
df['{}_{}d'.format(sma_ema, d)] = df['Close'].ewm( ignore_na=False,
span=int(d), ###
min_periods=0,
adjust=True
).mean()
else:
pass
# df=df.loc['2001-04-02':new_end_date] # new_end_date = '2001-08-02'
#df=df.loc['2006-08-01':new_end_date] # new_end_date = '2001-08-02'
print(stock_symbol)
df=df.loc[start_date:new_end_date]
df
...
判断long_day还需要附加条件 DatetimeIndex(['2005-03-29', '2005-03-30', '2005-04-05', '2005-04-12', '2005-04-13', '2005-04-15', '2005-04-21', '2005-04-28', '2005-05-02', '2005-05-09', '2005-05-12', '2005-05-13', '2005-05-16', '2005-05-17', '2005-05-24', '2005-06-09', '2005-06-10', '2005-06-13', '2005-06-21', '2005-06-24', '2005-07-05', '2005-07-07', '2005-07-19'], dtype='datetime64[ns]', name='Date', freq=None)
2005-03-29 ,BullishEngulfing 2005-03-30 ,3OutsideUp 2005-04-01 ,TweezersTop 2005-05-10 SpinningTop,BelowTheStomach 2005-05-11 TakuriLine,AboveTheStomach 2005-05-12 ClosingMarubozu 2005-05-13 ,1WhiteSoldier,BullishOutsideDay 2005-05-17 ClosingMarubozu,3WhiteSoldiers 2005-05-18 ,RisingWindow,3WhiteSoldiers(gap) 2005-05-19 ShortCandle,DescendingHawk
Figure 2. A Long White Candle(2005-03-29) is formed at a very high trading volume. A following candle(2005-03-30) is also formed at a trading volume significantly exceeding the average. These two candles create a strong support area.
Indeed, for a few weeks the bulls and the bears are struggling for control of the market. Eventually, a Three White Soldiers(2005-05-13,2005-05-16,2005-05-17) pattern is created which strength is shown on the third line formed at a high trading volume. The last peak forms a resistance zone but is forced by the bulls. The pattern is confirmed by a Rising Window(2005-05-18) formed at a very high trading volume. The bulls are in control of the stock.
stock : ROK : cce p98***
stock_symbol='ROK'
start_date='2000-12-01'
new_start_date = pd.to_datetime('2000-02-18')
new_end_date = '2001-01-31'
df = yf.download( stock_symbol, start=new_start_date, end=new_end_date)
df['Open_Close_mean']=(df['Open']+df['Close'])/2.
#df[['Open', 'High', 'Low','Close', 'Open_Close_mean']]
ma_d_c={'5':'blue', '10':'green', '15':'magenta', '20':'black', '50':'purple', '200': 'red'}
sma_ema='sma' #'ema'
# Exponential Moving Average
for d in ma_d_c.keys():
if sma_ema =='sma': # Simple Moving Average
df['{}_{}d'.format(sma_ema, d)] = df['Close'].rolling( int(d) ).mean()
elif sma_ema == 'ema': # Exponential Moving Average
df['{}_{}d'.format(sma_ema, d)] = df['Close'].ewm( ignore_na=False,
span=int(d), ###
min_periods=0,
adjust=True
).mean()
else:
pass
sma_ema='ema' #'ema'
# Exponential Moving Average
for d in ma_d_c.keys():
if sma_ema =='sma': # Simple Moving Average
df['{}_{}d'.format(sma_ema, d)] = df['Close'].rolling( int(d) ).mean()
elif sma_ema == 'ema': # Exponential Moving Average
df['{}_{}d'.format(sma_ema, d)] = df['Close'].ewm( ignore_na=False,
span=int(d), ###
min_periods=0,
adjust=True
).mean()
else:
pass
# df=df.loc['2001-04-02':new_end_date] # new_end_date = '2001-08-02'
#df=df.loc['2006-08-01':new_end_date] # new_end_date = '2001-08-02'
print(stock_symbol)
df=df.loc[start_date:new_end_date]
df
...
判断long_day还需要附加条件
DatetimeIndex(['2000-12-22', '2000-12-26', '2000-12-27', '2000-12-28',
'2001-01-02', '2001-01-12', '2001-01-25'],
dtype='datetime64[ns]', name='Date', freq=None)
2000-12-26 OpeningMarubozu 2000-12-27 ,3WhiteSoldiers(gap) 2000-12-28 ,3WhiteSoldiers 2000-12-29 SpinningTop,BearishMeetingLine 2001-01-02 ,EveningStar 2001-01-04 ShootingStar1
stock : INTC
stock_symbol='INTC'
start_date='1998-03-06'
new_start_date = pd.to_datetime('1997-05-15')
new_end_date = '1998-05-19'
df = yf.download( stock_symbol, start=new_start_date, end=new_end_date)
df['Open_Close_mean']=(df['Open']+df['Close'])/2.
#df[['Open', 'High', 'Low','Close', 'Open_Close_mean']]
ma_d_c={'5':'blue', '10':'green', '15':'magenta', '20':'black', '50':'purple', '200': 'red'}
sma_ema='sma' #'ema'
# Exponential Moving Average
for d in ma_d_c.keys():
if sma_ema =='sma': # Simple Moving Average
df['{}_{}d'.format(sma_ema, d)] = df['Close'].rolling( int(d) ).mean()
elif sma_ema == 'ema': # Exponential Moving Average
df['{}_{}d'.format(sma_ema, d)] = df['Close'].ewm( ignore_na=False,
span=int(d), ###
min_periods=0,
adjust=True
).mean()
else:
pass
sma_ema='ema' #'ema'
# Exponential Moving Average
for d in ma_d_c.keys():
if sma_ema =='sma': # Simple Moving Average
df['{}_{}d'.format(sma_ema, d)] = df['Close'].rolling( int(d) ).mean()
elif sma_ema == 'ema': # Exponential Moving Average
df['{}_{}d'.format(sma_ema, d)] = df['Close'].ewm( ignore_na=False,
span=int(d), ###
min_periods=0,
adjust=True
).mean()
else:
pass
# df=df.loc['2001-04-02':new_end_date] # new_end_date = '2001-08-02'
#df=df.loc['2006-08-01':new_end_date] # new_end_date = '2001-08-02'
print(stock_symbol)
df=df.loc[start_date:new_end_date]
df
...
1998-04-23 Doji,Northern
1998-04-24 LongLegged Doji(实体足够小)
1998-04-14 SpinningTop,DescendingHawk
1998-04-15 ,BearishEngulfing,BearishOutsideDay
1998-04-16 ShortCandle
1998-04-20 ,3WhiteSoldiers
1998-04-21 ,RisingWindow,3WhiteSoldiers(gap)
1998-04-22 ,RisingWindow,3WhiteSoldiers(gap)
1998-04-24 HighWave
Exhibit 6.31 illustrates almost a classic three white soldiers(1998-04-16, 1998-04-17,1998-04-20) since each candle, especially the last two, were relatively strong, opening near their lows and closing at, or near, their highs. A sign of hesitation came with the doji(1998-04-23) on April 23 since it formed a harami cross(harami cross :trading range inside the price range of the prior day)我认为Northern Doji足够.
stock : MSFT : 3WhiteSoldiers(gap)
stock_symbol='MSFT'
start_date='1997-12-01'
new_start_date = pd.to_datetime('1997-02-18')
new_end_date = '1998-02-03'
df = yf.download( stock_symbol, start=new_start_date, end=new_end_date)
df['Open_Close_mean']=(df['Open']+df['Close'])/2.
#df[['Open', 'High', 'Low','Close', 'Open_Close_mean']]
######################since GILD stock split
if stock_symbol=='GILD':
df.loc[:,
['Open', 'High', 'Low','Close', 'Open_Close_mean','Adj Close']
]=df.loc[:,['Open', 'High', 'Low','Close', 'Open_Close_mean','Adj Close']]*4
elif stock_symbol=='MSFT' and start_date=='1997-12-01':
df.loc[:,
['Open', 'High', 'Low','Close', 'Open_Close_mean','Adj Close']
]=df.loc[:,['Open', 'High', 'Low','Close', 'Open_Close_mean','Adj Close']]*2
ma_d_c={'5':'blue', '10':'green', '15':'magenta', '20':'black', '50':'purple', '200': 'red'}
sma_ema='sma' #'ema'
# Exponential Moving Average
for d in ma_d_c.keys():
if sma_ema =='sma': # Simple Moving Average
df['{}_{}d'.format(sma_ema, d)] = df['Close'].rolling( int(d) ).mean()
elif sma_ema == 'ema': # Exponential Moving Average
df['{}_{}d'.format(sma_ema, d)] = df['Close'].ewm( ignore_na=False,
span=int(d), ###
min_periods=0,
adjust=True
).mean()
else:
pass
sma_ema='ema' #'ema'
# Exponential Moving Average
for d in ma_d_c.keys():
if sma_ema =='sma': # Simple Moving Average
df['{}_{}d'.format(sma_ema, d)] = df['Close'].rolling( int(d) ).mean()
elif sma_ema == 'ema': # Exponential Moving Average
df['{}_{}d'.format(sma_ema, d)] = df['Close'].ewm( ignore_na=False,
span=int(d), ###
min_periods=0,
adjust=True
).mean()
else:
pass
# df=df.loc['2001-04-02':new_end_date] # new_end_date = '2001-08-02'
#df=df.loc['2006-08-01':new_end_date] # new_end_date = '2001-08-02'
print(stock_symbol)
df=df.loc[start_date:new_end_date]
df
...
1997-12-26 ClosingMarubozu 1997-12-29 ,RisingWindow 1997-12-30 ,3WhiteSoldiers(gap) 1997-12-31 ShortCandle 1998-01-02 ShortCandle,TweezersTop 1998-01-05 SpinningTop,BearishOutsideDay 1998-01-07 HighWave,BelowTheStomach 1998-01-08 ShortCandle,TweezersBottom 1998-01-12 ,PiercingPattern
Exhibit 6.32 has a good example of the three white soldiers(1997-12-26,1997-12-29,1997-12-30). Each of the three candle lines closed very near to the highs of the session and each white candle opened within or above the prior white candle. An aspect to consider is by the time the three white soldiers is completed, the market could be well off its lows. In this case, Microsoft was almost $3 from its lows, a high percentage move. Consequently, unless one is longer-term bullish, buying at the completion of these three white soldiers may not present an attractive risk/reward因此,除非长期看涨,否则在这three white soldiers完成时买入可能不会带来有吸引力的风险/回报.
I have found that on corrections, the first or second white candle that started the three white soldiers is often support. In this example, the stock consolidated after three white soldiers and slowly pulled back until a Piercing Pattern(1998-01-09,1998-01-12) was formed. That tended to confirm support within the second white candle of the three soldiers.
stock : praxair : 3WhiteSoldiers(gap)
stock_symbol='praxair'# https://www.investing.com/equities/praxair-inc-historical-data
start_date='2000-06-01'
new_start_date = pd.to_datetime('19990816')
new_end_date = '20000901'
df = pd.read_csv(stock_symbol + \
str(new_start_date.year).zfill(4) + str(new_start_date.month).zfill(2) + str(new_start_date.day).zfill(2) + \
'_{}.csv'.format(new_end_date),
index_col='Date', parse_dates=['Date'],
#dtype={'Price':'np.float64', 'Open':'np.float64', 'High':np.float64, 'Low':np.float64}
#dtype={'Vol.':int}
)
df.rename(columns={'Price':'Close', 'Vol.':'Volume'}, inplace=True)
def value_to_float(x):
if type(x) == float or type(x) == int:
return x
if 'K' in x:
if len(x) > 1:
return float(x.replace('K', '')) * 1000
return 1000.0
if 'M' in x:
if len(x) > 1:
return float(x.replace('M', '')) * 1000000
return 1000000.0
if 'B' in x:
return float(x.replace('B', '')) * 1000000000
return 0.0
df['Volume'] = df['Volume'].apply(value_to_float)
df['Open_Close_mean']=(df['Open']+df['Close'])/2.
df['Adj Close']=df['Close']#########
# only for tso stock
df=df[['Open', 'High', 'Low','Close', 'Adj Close','Volume','Open_Close_mean']]
##############