data("ToothGrowth")
df <- ToothGrowth
df$dose <- as.factor(df$dose)
# Create some plots
# ::::::::::::::::::::::::::::::::::::::::::::::::::
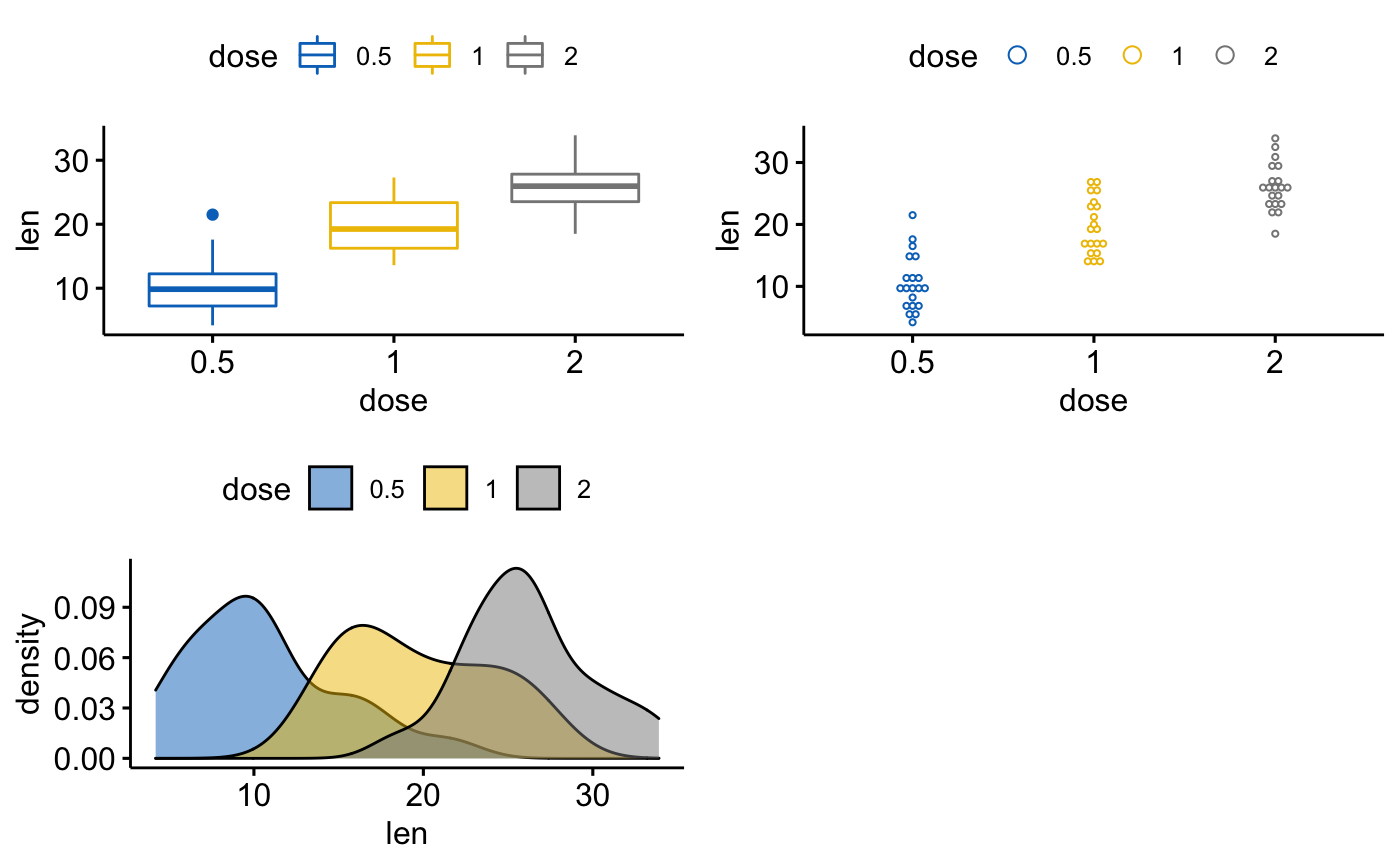
# Box plot
bxp <- ggboxplot(df, x = "dose", y = "len",
color = "dose", palette = "jco")
# Dot plot
dp <- ggdotplot(df, x = "dose", y = "len",
color = "dose", palette = "jco")
# Density plot
dens <- ggdensity(df, x = "len", fill = "dose", palette = "jco")
# Arrange
# ::::::::::::::::::::::::::::::::::::::::::::::::::
ggarrange(bxp, dp, dens, ncol = 2, nrow = 2)
#> `stat_bindot()` using `bins = 30`. Pick better value with `binwidth`.


 超级会员免费看
 本文介绍如何利用R语言中的ggarrange包有效地排列和组合多个ggplot2图表,帮助你创建复杂的多图展示,提高数据可视化效率。


 291
291

 被折叠的 条评论
为什么被折叠?
被折叠的 条评论
为什么被折叠?
 到【灌水乐园】发言


