


Ch9-Ch10 获取数据、数据工作
此系列记录《数据科学入门》学习笔记(停止)
Chap 9 获取数据(只有9.2)
9.2.1 文本文件基础
# 'r'意味只读
file_for_reading = open('reading_file.txt', 'r')

# 'r'意味写入,会破坏已存在的文件
file_for_writing = open('reading_file.txt', 'r')

# 'a'意味添加,加入文件的末尾
file_for_appending = open('appending_file.txt', 'a')

# 关闭文件
file_for_writing.close()

# 实际操作中会经常忘记关闭文件,通过在with程序块里操作,文件会在结尾处自动关闭
with open(filename, 'r') as f:
    data = function_that_gets_data_from(f)

# 可以通过for语句对文件的行进行迭代
starts_with_bash = 0

with open('input.txt', 'r') as f:
    for line in file:
        if re.match("^#", line):
            starts_with_bash += 1
# 提取邮箱@后面的部分,并计数
from collections import Counter
def get_domain(email_address):
"""split on '@' and return the last piece"""
return email_address.lower().split("@")[-1]
with open('C://Users//nijie//Desktop//email_addresses.txt', 'r') as f:
domain_counts = Counter(get_domain(line.strip())
for line in f
if "@" in line)
# dahAodSAaoho@163.com
# saZhoZfg@qq.com
# saZhEohfii@dahia.agiuh
# dagihfoai@gmail.edu.cn
# dahGZSiIHInkncd@126.com
# ahdahi@163.com
# aZsaChojhi@126.com
# haigZdaiygti@163.com
domain_counts
# Counter({'126.com': 2,
# '163.com': 3,
# 'dahia.agiuh': 1,
# 'gmail.edu.cn': 1,
# 'qq.com': 1})9.2.2 限制的文件
import csv

with open('C://Users//nijie//Desktop//tab_delimited_stock_prices.txt', 'r', encoding="utf-8") as f:
    reader = csv.reader(f, delimiter='\t')
    for row in reader:
        date = row[0]
        symbol = row[1]
        closing_price = float(row[2])
        print(date, symbol, closing_price)

# 6/20/2014 AAPL 90.91
# 6/20/2014 MSFT 41.68
# 6/20/2014 FB 64.5
# 6/19/2014 AAPL 91.86
# 6/19/20 14 MSFT 41.51
# 6/19/2014 FB 64.34
# 当文件存在表头,以字典的形式读入,第一行为字典
with open('C://Users//nijie//Desktop//colon_delimited_stock_prices.txt', 'r', encoding="utf-8") as f:
reader = csv.DictReader(f, delimiter=':')
for row in reader:
date = row['date']
symbol = row['symbol']
closing_price = float(row['closing_price'])
print(date, symbol, closing_price)
# 6/20/2014 AAPL 90.91
# 6/20/2014 MSFT 41.68
# 6/20/2014 FB 64.5
# 6/19/2014 AAPL 91.86
# 6/19/2014 MSFT 41.51
# 6/19/2014 FB 64.3410.1.1 探索一维数据
import math
from collections import Counter
import matplotlib.pyplot as plt
from pylab import *

def bucketize(point, bucket_size):
    """floor the point to the next lower multyple of bucket_size"""
    return bucket_size * math.floor(point / bucket_size)

def make_histogram(points, bucket_size):
    """buckets the points and counts how many in each bucket"""
    return Counter(bucketize(point, bucket_size) for point in points)

def plot_histogram(points, bucket_size, title=""):
    mpl.rcParams['font.sans-serif'] = ['SimHei']
    mpl.rcParams['axes.unicode_minus'] = False
    histogram = make_histogram(points, bucket_size)
    plt.bar(histogram.keys(), histogram.values(), width=bucket_size)
    plt.title(title)
    plt.show()
import math
def normal_cdf(x, mu=0, sigma=1):
return (1 + math.erf((x - mu) / math.sqrt(2) / sigma)) / 2
def inverse_normal_cdf(p, mu=0, sigma=1, tolerance=0.00001):
# 如果非标准型,先调整单位使之服从标准型
if mu != 0 or sigma != 1:
return mu + sigma * inverse_normal_cdf(p, tolerance=tolerance)
low_z, low_p = -10, 0 # normal_cdf(-10) -> 0
hi_z, hi_p = 10, 1 # normal_cdf(10) -> 1
while hi_z - low_z > tolerance:
mid_z = (low_z + hi_z) / 2 # midpoint
mid_p = normal_cdf(mid_z) # 考虑cdf在那里的值
if mid_p < p:
# midpoint仍然太低,搜索比他大的值
low_z, low_p = mid_z, mid_p
elif mid_p > p:
# midpoint仍然太高,搜索比他小的值
hi_z, hi_p = mid_z, mid_p
else:
break
return mid_zimport random
random.seed(0)
# -100到100之间均匀抽取
uniform = [200 * random.random() - 100 for _ in range(10000)]
# 均值为0标准差为57的正态分布
normal = [57 * inverse_normal_cdf(random.random()) for _ in range(10000)]
plot_histogram(uniform, 10, '均匀分布的直方图')
plot_histogram(normal, 10, '正态分布的直方图')
10.1.2 二维数据
def random_normal():
    """returns a random draw from a standard normal distribution"""
    return inverse_normal_cdf(random.random())

xs = [random_normal() for _ in range(1000)]
ys1 = [ x + random_normal() / 2 for x in xs]
ys2 = [-x + random_normal() / 2 for x in xs]

# ys1和ys2的分布相同
plot_histogram(ys1, 10)
plot_histogram(ys2, 10)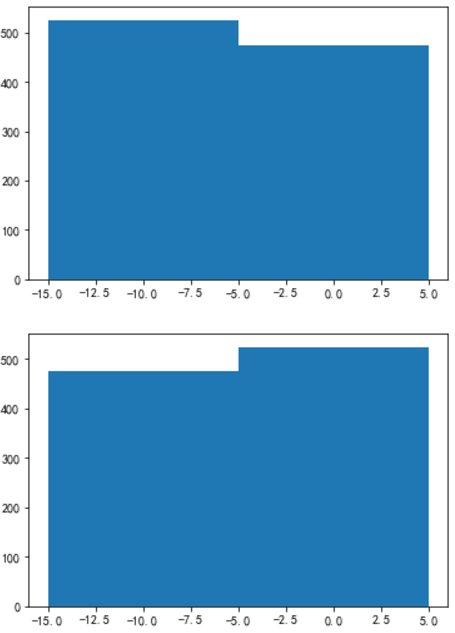
plt.scatter(xs, ys1, marker='+', color='k', label='ys1')
plt.scatter(xs, ys2, marker='*', color='g', label='ys2')
plt.xlabel('xs')
plt.ylabel('ys')
plt.legend(loc=9)
plt.title('差别很大的联合分布')
plt.show()
import numpy as np
print(np.corrcoef(xs, ys1)[0, 1])
print(np.corrcoef(xs, ys2)[0, 1])
# 0.9010493686379657
# -0.8920981526879997
10.1.3 多维数据
# 相关系数矩阵

def correlation(x, y):
    cov = sum((x_i - mean(x)) * (y_i - mean(y)) for x_i, y_i in zip(x, y)) / (len(x) - 1)
    disx = sum((x_i - mean(x)) ** 2 for x_i in x) / (len(x) - 1)
    disy = sum((y_i - mean(y)) ** 2 for y_i in y) / (len(x) - 1)
    return sum(cov / np.sqrt(disx) / np.sqrt(disy))

def get_column(x, j):
    return x[:, j]

def make_matrix(num_rows, num_cols, entry_fn):
    return [[entry_fn(i, j) for j in range(num_cols)] for i in range(num_rows)]

def correlation_matrix(data):
    """returns the num_columns x num_columns matrix whose (i, j)th entry is the corralation between column i and j data"""
    _, num_columns = shape(data)

    def matrix_entry(i, j):
        return correlation(get_column(data, i), get_column(data, j))

    return make_matrix(num_columns, num_columns, matrix_entry)

data = np.vstack((list(range(10)), list(range(10, 20))))
print(data)
print(correlation_matrix(data.T))
print(np.corrcoef(data))
# [[ 0  1  2  3  4  5  6  7  8  9]
#  [10 11 12 13 14 15 16 17 18 19]]
# [[0.9999999999999999, 0.9999999999999999], [0.9999999999999999, 0.9999999999999999]]
# [[1. 1.]
# [1. 1.]]
# 散点图阵
x = range(50)
x1 = [random.gauss(mu=5 + i, sigma=1) for i in range(50)]
x2 = [random.uniform(a=1 + i ** 2, b=10) for i in range(50)]
x3 = [random.gauss(mu=5 - i, sigma=1) for i in range(50)]
x4 = [random.uniform(a=5 + 2 * i, b=10) for i in range(50)]
data = (np.vstack((x1, x2, x3, x4))).T
import matplotlib.pyplot as plt
_, num_columns = shape(data)
fig, ax = plt.subplots(num_columns, num_columns)
for i in range(num_columns):
for j in range(num_columns):
# x轴上column_j对y轴上column_i的散点
if i != j: ax[i][j].scatter(get_column(data, j), get_column(data, i))
# 只有当i == j时显示序列名
else: ax[i][j].annotate("series" + str(i), (0.5, 0.5), xycoords='axes fraction', ha="center", va='center')
# 除了图的左侧和下方之外,隐藏图的标记
if i < num_columns - 1: ax[i][j].xaxis.set_visible(False)
if j > 0: ax[i][j].yaxis.set_visible(False)
# 修复右下方和左下方的图标记
# 因为只有他们是文本,是错误的
ax[-1][-1].set_xlim(ax[0][-1].get_xlim())
ax[0][0].set_ylim(ax[0][1].get_ylim())
plt.show()
10.2 清理与修改
from dateutil.parser import parse

# def parse_row(input_row, parses):
#     """given a list of parsers (some of which may be None) apply the appropriate one to each element of the input_row"""
#     return [parser(value) if parser is not None else value for value, parser in zip(input_now, parsers)]

def parse_rows_with(reader, parsers):
    """wap a redder to apply the parsers to each of its rows"""
    for row in reader:
        yield parse_row(row, parsers)

def try_or_none(f):
    """wraps f to return None if f raises an exception assumes f takes only one inpot"""
    def f_or_none(x):
        try: return f(x)
        except: return None
    return f_or_none

def parse_row(input_row, parsers):
    return [try_or_none(parser)(value) if parser is not None else value for value, parser in zip(input_row, parsers)]
# date symbol closing_price
# 6/20/2014 AAPL 90.91
# 6/20/2014 MSFT 41.68
6/20/3014 FB 64.5
6/19/2014 AAPL 91.86
6/19/2014 MSFT n/a
6/19/2014 FB 64.34
import csv
import dateutil.parser
data = []
with open('C://Users//nijie//Desktop//comma_delimited_stock_prices.csv', 'r', encoding='utf-8') as f:
reader = csv.reader(f)
for line in parse_rows_with(reader, [dateutil.parser.parse, None, float]):
data.append(line)
for row in data:
if any(x is None for x in row):
print(row)
# [None, 'symbol', None]
# [datetime.datetime(2014, 6, 19, 0, 0), 'MSFT', None]10.3 数据处理
# 数据是瞎打的
import datetime

data = [{'closing_price': 102.06,
         'date': datetime.datetime(2014, 8, 29, 0, 0),
         'symbol': 'AAPL'},
        {'closing_price': 156.59,
         'date': datetime.datetime(2014, 8, 29, 0, 0),
         'symbol': 'MSFT'},
        {'closing_price': 72.91,
         'date': datetime.datetime(2014, 8, 29, 0, 0),
         'symbol': 'FB'},
         {'closing_price': 105.66,
         'date': datetime.datetime(2014, 8, 30, 0, 0),
         'symbol': 'AAPL'},
        {'closing_price': 145.17,
         'date': datetime.datetime(2014, 8, 30, 0, 0),
         'symbol': 'MSFT'},
        {'closing_price': 80.43,
         'date': datetime.datetime(2014, 8, 30, 0, 0),
         'symbol': 'FB'},
         {'closing_price': 101.15,
         'date': datetime.datetime(2014, 8, 31, 0, 0),
         'symbol': 'AAPL'},
        {'closing_price': 146.32,
         'date': datetime.datetime(2014, 8, 31, 0, 0),
         'symbol': 'MSFT'},
        {'closing_price': 63.87,
         'date': datetime.datetime(2014, 8, 31, 0, 0),
         'symbol': 'FB'}
        ]
# 求AAPL最高收盘价
max_aapl_price = max(row['closing_price'] for row in data if row['symbol'] == 'AAPL')
max_aapl_price
# 105.66

# 按照股票代码分组,输出每个股票的最高收盘价
from collections import defaultdict

by_symbol = defaultdict(list)
for row in data:
    by_symbol[row['symbol']].append(row)

# 使用字典解析找到每个股票代码的最大值
max_price_by_symbol = {symbol: max(row['closing_price'] for row in grouped_rows)
                       for symbol, grouped_rows in by_symbol.items()}
max_price_by_symbol
# {'AAPL': 105.66, 'FB': 80.43, 'MSFT': 156.59}
def picker(field_name):
    """returns a function that picks field out of a dict"""
    return lambda row: row[field_name]

def pluck(field_name, rows):
    """turn a list of dicts into the list of field_name values"""
    return map(picker(field_name), rows)

def group_by(grouper, rows, value_transform=None):
    # 键是分组情况的输出,值是行的列表
    grouped = defaultdict(list)
    for row in rows:
        grouped[grouper(row)].append(row)

    if value_transform is None:
        return grouped
    else:
        return {key: value_transform(rows) for key, rows in grouped.items()}

max_price_by_symbol = group_by(picker('symbol'), data, lambda rows: max(pluck('closing_price', rows)))
max_price_by_symbol
# {'AAPL': 105.66, 'FB': 80.43, 'MSFT': 156.59}
# 计算单日百分比
def percent_price_change(yesterday, today):
    return today['closing_price'] / yesterday['closing_price'] - 1

def day_over_day_changes(grouped_rows):
    # 按日期对行进行排序
    ordered = sorted(grouped_rows, key=picker('date'))
    # ordered = sorted(grouped_rows, key=lambda x: (picker('symbol')(x), picker('date')(x)))

    # 对偏移量应用zip函数得到连续两天的成对表示
    return [{'symbol': today['symbol'],
             'date': today['date'],
             'change': percent_price_change(yesterday, today)}
            for yesterday, today in zip(ordered, ordered[1:])]

# 键是股票代码,值是一个‘change’字典列表
changes_by_symbol = group_by(picker('symbol'), data, day_over_day_changes)

#收集所有‘change’字典放入一个大列表中,字典套字典,需要两个for
all_changes = [change
               for changes in changes_by_symbol.values()
               for change in changes]

display(all_changes)
print(max(all_changes, key=picker('change')))
print(min(all_changes, key=picker('change')))
# 以下为输出结果
[{'change': 0.03527336860670194,
  'date': datetime.datetime(2014, 8, 30, 0, 0),
  'symbol': 'AAPL'},
 {'change': -0.04268408101457499,
  'date': datetime.datetime(2014, 8, 31, 0, 0),
  'symbol': 'AAPL'},
 {'change': -0.07292930583051294,
  'date': datetime.datetime(2014, 8, 30, 0, 0),
  'symbol': 'MSFT'},
 {'change': 0.007921746917407324,
  'date': datetime.datetime(2014, 8, 31, 0, 0),
  'symbol': 'MSFT'},
 {'change': 0.10314085859278577,
  'date': datetime.datetime(2014, 8, 30, 0, 0),
  'symbol': 'FB'},
 {'change': -0.2058933233867961,
  'date': datetime.datetime(2014, 8, 31, 0, 0),
  'symbol': 'FB'}]
{'symbol': 'FB', 'date': datetime.datetime(2014, 8, 30, 0, 0), 'change': 0.10314085859278577}
{'symbol': 'FB', 'date': datetime.datetime(2014, 8, 31, 0, 0), 'change': -0.2058933233867961}
# 为了组合百分比的变化,我们对每一项加1,把他们相乘再减去1,
# 例如: (1 + 10%) * (1 - 20%) - 1 = 1.1 * 0.8 - 1 = -12%
def combine_pct_changes(pct_change1, pct_change2):
return (1 + pct_change1) * (1 + pct_change2) - 1
def overall_change(changes):
return reduce(combine_pct_changes, pluck('change', changes))
overall_change_by_month = group_by(lambda row: row['date'].month, all_changes, overall_change)10.3 数据调整
<table>
  <tr>
    <th width=25%, bgcolor = lightblue> 观测对象</th>
    <th width=25%, bgcolor = lightblue> 身高(英寸)</th>
    <th width=25%, bgcolor = lightblue> 身高(厘米)</th>
    <th width=25%, bgcolor = lightblue> 体重(磅)</th>
  </tr>
  <tr>
    <td bgcolor=lightgrey> A </td>
    <td> 63 </td>
    <td> 160  </td>
    <td> 150  </td>
  </tr>
  <tr>
    <td bgcolor=lightgrey> B </td>
    <td> 67 </td>
    <td> 170.2 </td>
    <td> 160  </td>
  </tr>
  <tr>
    <td bgcolor=lightgrey> C </td>
    <td> 70 </td>
    <td> 177.8  </td>
    <td> 171  </td>
  <tr>
</table>
import math

def distance(v, w):
    return math.sqrt(sum((v_i - w_i) ** 2 for v_i, w_i in zip(v, w)))

# 英寸为单位
a_to_b = distance([63, 150], [67, 160]);print(a_to_b)
a_to_c = distance([63, 150], [70, 171]);print(a_to_c)
b_to_c = distance([67, 160], [70, 171]);print(b_to_c)

print('----------------------------------------------')

# 厘米为单位
a_to_b = distance([160, 150], [170.2, 160]);print(a_to_b)
a_to_c = distance([160, 150], [177.8, 171]);print(a_to_c)
b_to_c = distance([170.2, 160], [177.8, 171]);print(b_to_c)

# 10.770329614269007
# 22.135943621178654
# 11.40175425099138
----------------------------------------------
# 14.284257068535268
# 27.52889391167034
# 13.370115930686627
10.5 降维(只有书上所有代码)
# 标准化
def get_column(data, j):
    return data[:, j]

def standard_deviation(v):
    n = len(v)
    v_bar = mean(v)
    return math.sqrt(sum((v_i - v_bar) ** 2) / (n - 1))

def make_matrix(num_rows, num_cols, entry_fn):
    return [[entry_fn(i, j) for j in range(num_cols)] for i in range(num_rows)]

def scale(data_matrix):
    """returns the means and standar deviations of each column"""
    num_rows, nun_cols = shape(data_matrix)
    means = [mean(get_column(data_matrix, j)) for j in range(num_cols)]
    stdevs = [standard_deviation(get_column(data_matrix, j)) for j in range(num_cols)]
    return mans, stdevs

def rescale(data_matrix):
    """rescales the input data so that each column has mean 0 and standard deviation 1 leaves alone columns with no deviation"""
    means, stdevs = scale(data_matrix)

    def rescaled(i, j):
        if stdevs[j] > 0:
            return (data_matrix[i, j] - means[j]) / stedvs[j]
# 将数据均值化为零

def de_mean_matrix(A):
    """returns the result of subtracting from every value in A the mean value of its column.
       the resulting matrix has mean theta in every column"""
    nr, nc = shape(A)
    columns_means, _ = scale(A)
    return make_matrix(nr, nc, lambda i, j: A[i][j] - columns_mean[j])


import math

def magnitude(w):
    return math.sqrt(sum(w_i ** 2 for w_i in w))

def direction(w):
    mag = magnitude(w)
    return [w_i / mag for w_i in w]

def dot(v, w):
    return sum(v_i * w_i for v_i, w_i in zip(v, w))

def directional_variance_i(x_i, w):
    """the variance of the row x_i in the direction determined by w"""
    return dot(x_i, direction(w)) ** 2

def directional_variance(x, w):
    """the variance of the data in the direction determined w"""
    return sun(directional_variance_i(x_i, w) for x_i in x)

# 通过梯度函数可以找出使方差最大的方向
def directional_variance_gradient_i(x_i, w):
    """the contribution of row_x_i to the gradient of the direction_w variance"""
    projection_length = dot(x_i, direction(w))
    return [2 * projection_length * x_ij for x_ij in x_i]

def directional_variance_gradient(x, w):
    return vector_sum(directional_variance_gradient_i(x_i, w) for x_i in x)


        else:
            return data_matrix[i, j]

    num_rows, num_cols = shape(data_matrix)
    return make_matrix(num_rows, num_cols, rescaled)
def minimize_batch(target_fn, gradient_fn, theta_0, tolerance=0.000001):
"""use gradient descent to find theta that minimizes target fuction"""
step_sizes = [100, 10, 1, 0.1, 0.01, 0.001, 0.0001, 0.00001]
theta = theta_0 # 设定theta为初始值
target_fn = safe(target_fn) # target_fn的安全版
value = target_fn(theta) # 试图最小化的值
while True: # while true为死循环,需要用break来退出
gradient = gradient_fn(theta)
next_thetas = [step(theta, gradient, -step_size) for step_size in step_sizes]
# 选择一个使残差函数最小的值
next_theta = min(next_thetas, key=target_fn)
next_value = target_fn(next_theta)
# 当‘收敛’时停止
if abs(value - next_value) < tolerance:
return theta
else:
theta, value = next_theta, next_value
def negate(f):
"""return a function that for any input x returns -f(x)"""
return lambda *args, **kwargs: -f(*args, **kwargs)
def negate_all(f):
"""the same when f returns a list of numbers"""
return lambda *args, **kwargs: [-y for y in f(*args, **kwargs)]
def maximize_batch(target_fn, gradient_fn, theta-0, tolerance=0.000001):
return minimize_batch(negate(target_fn), negate_all(gradient_fn), theta_0)
# 使directional_variance最大的方向就是第一主成分
from functools import partial
def first_princinple_component(x):
guess = [1 for _ in x[0]]
unscaled_maximizer = maximize_batch(
partial(directional_variance, x),
partial(directional_variance_gradient, x). guess)
return direction(unscaled_maximizer)
def project(v, w):
projection_length = dot(v, w)
return scalar_multiply(projection_length, w)
def remove_projection_from_vector(v, w):
return vector_substract(v, project(v, w))
def remove_projection(x, w):
return [remove_projection_from_vector(x_i, w) for x_i in x]
def principal_component_analysis(x, num_components):
components = []
for _ in range(num_components):
component = first_principal_component(x)
components.append(component)
x = remove_projection(x, component)
return components
def transform_vector(v, components):
return [dot(v, w) for w in components]
def transform(x, components):
return [transform_vector(x_i, components) for x_i in x]在学习过程中,我发现自己不太适合这本书的方法与模式,所以这本书的学习以及博客更新到此结束。
以上是Ch9、Ch10的相关内容
2018.03.10 YR


 1055
1055

 被折叠的 条评论
为什么被折叠?
被折叠的 条评论
为什么被折叠?
 到【灌水乐园】发言


