


 Shapefile是地图元素矢量数据文件格式,包括.shp(图形),.shx(图形索引)和.dbf(属性数据)文件。Python的pyshp库可以用于读写Shapefile。文章提供了创建和写入三维坐标的示例,并提到QGIS等工具可用于数据可视化。每个Shapefile仅能包含一种几何类型,并且文件大小有限制。
1.定义
shapefile为地图元素矢量数据文件。
2.文件保存
保存为shapefile矢量图形格式,每类型元素(车道线、人行横道、交通灯等)一个shapefile文件(整张地图拼接后的数据)。
3.数据格式说明
-
.shp— 图形格式,用于保存元素的几何实体。
-
.shx— 图形索引格式。几何体位置索引,记录每一个几何体在shp文件之中的位置,能够加快向前或向后搜索一个几何体的效率。
-
.dbf— 属性数据格式,以dBase IV的数据表格式存储每个几何形状的属性数据。
注意:数据类型不同需保存为不同的shapefile中(几何体的类型必须与文件头中定义的类型一致)。
4.参考文档
python读写文件调用参考:
GitHub - GeospatialPython/pyshp: This library reads and writes ESRI Shapefiles in pure Python.
安装方法:pip install pyshp
可视化工具:ArcGIS、Global Mapper和QGIS等
5.示例
三维坐标写入方法:
import shapefile

shapname = "result"
with shapefile.Writer(shapname) as w:
    w.field("name", "C")
    data1 = [
    [631.2282357164181, 1617.9577280681747, 0.0],
    [630.1692210640408, 1617.5979425383198, 0.0],
    [628.9333712368947, 1616.8095034402288, 0.0]]
    data2 = [
    [631.2282357164181, 1617.9577280681747, 0.0],
    [630.1692210640408, 1617.5979425383198, 0.0],
    [628.9333712368947, 1616.8095034402288, 0.0]]
    w.linez([data1])    ##如果为polygon需要使用w.polyz([data1]),data1中的数据不需要闭合
    w.record("cross1")
    w.linez([data2])
    w.record("line1")
只写入.shp文件:
import shapefile

shapname = "result.shp"
with shapefile.Writer(shp=shapname) as w:
    data1 = [[1.0, 2.0, 3.0], [4.0, 5.0, 6.0], [7.0, 8.0, 9.0], [10.0, 11.0, 12.0]]
    w.linez([data1])
    data2 = [[0.1, 0.2, 0.3], [0.4, 0.5, 0.6]]
    w.linez([data2])
读取方法:
import shapefile
import numpy as np

shapname = "result"
with shapefile.Reader(shapname) as sf:
#with shapefile.Reader(shp=shapname+".shp") as sf:  ##只读.shp文件
    datas = sf.shapes()
    for data in datas:
        points = data.points
        x,y = zip(*points)
        z = data.z
        tmp = np.array([x, y, z])
        tmpt = tmp.transpose()
6.QGIS可视化
地面元素shapefile分为:curb.shp,line.shp,crosswalk.shp,三个图层可视化效果:
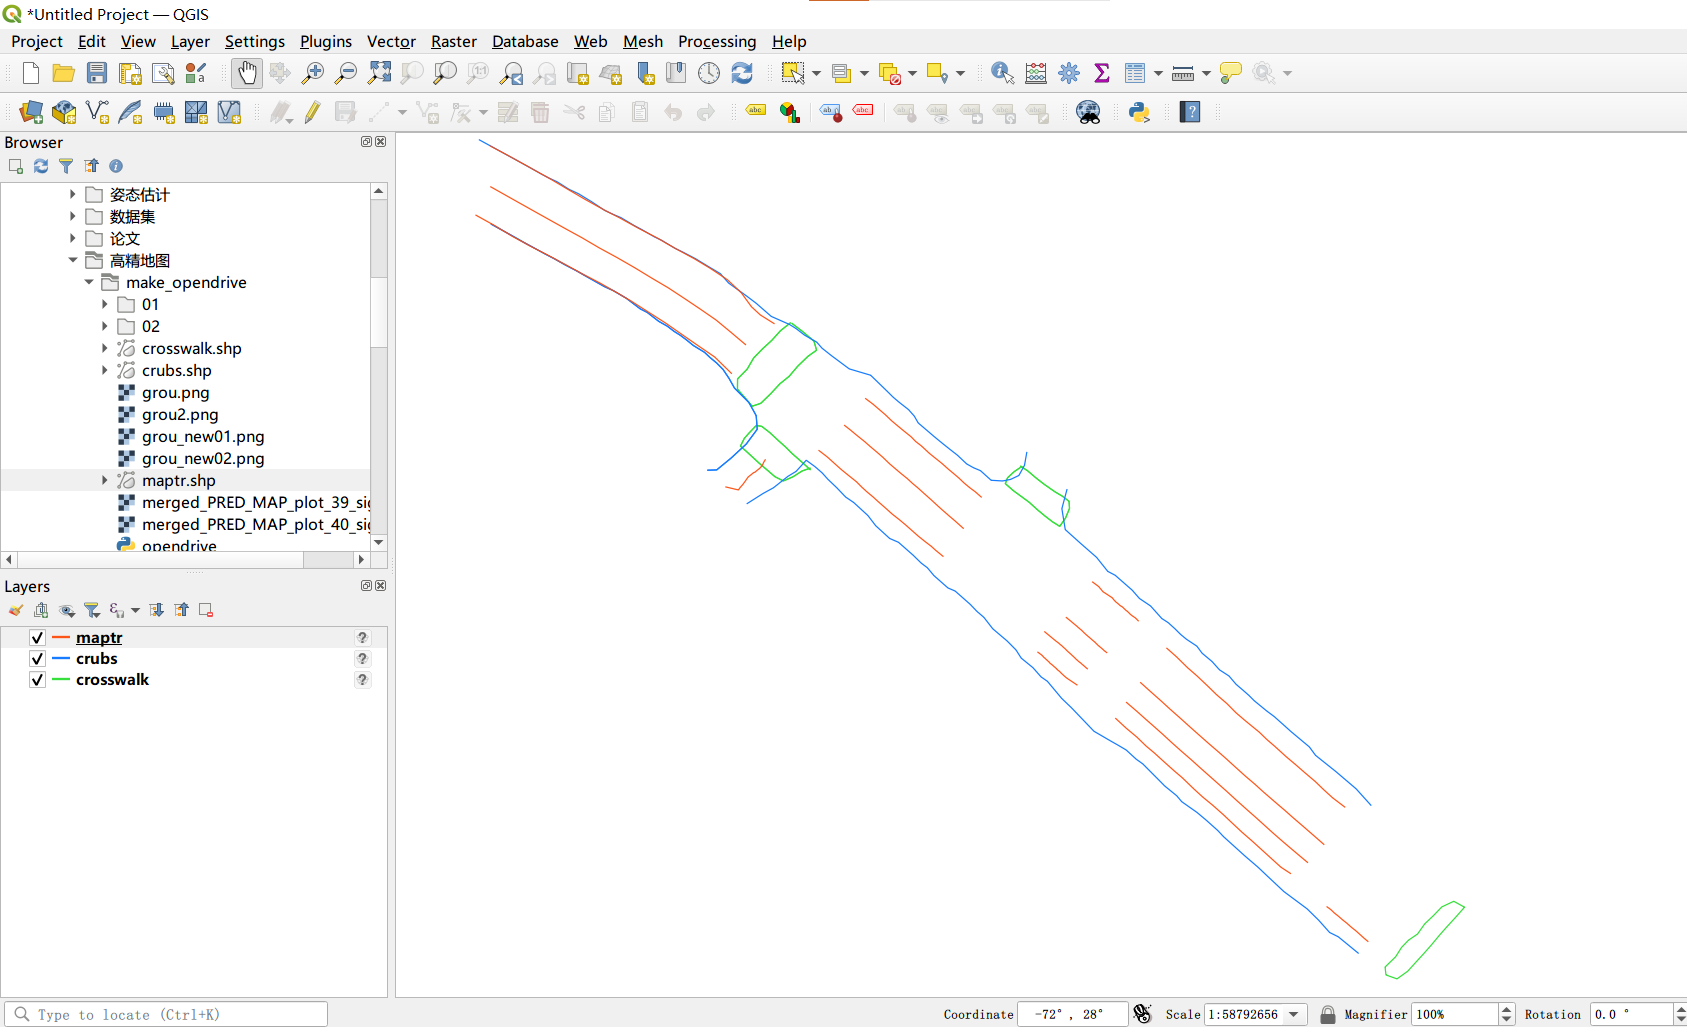
(1)可视化需要shapefile三个文件(.shp,.shx,.dbf)。
(2).shp文件或.dbf文件最大的体积不能够超过2 GB(或2位),最多只能够存储七千万个点坐标。


 769
769

 被折叠的 条评论
为什么被折叠?
被折叠的 条评论
为什么被折叠?
 到【灌水乐园】发言


