


Power Network
| Time Limit: 2000MS | Memory Limit: 32768K | |
| Total Submissions: 25116 | Accepted: 13083 |
Description
A power network consists of nodes (power stations, consumers and dispatchers) connected by power transport lines. A node u may be supplied with an amount s(u) >= 0 of power, may produce an amount 0 <= p(u) <= p
max(u) of power, may consume an amount 0 <= c(u) <= min(s(u),c
max(u)) of power, and may deliver an amount d(u)=s(u)+p(u)-c(u) of power. The following restrictions apply: c(u)=0 for any power station, p(u)=0 for any consumer, and p(u)=c(u)=0 for any dispatcher. There is at most one power transport line (u,v) from a node u to a node v in the net; it transports an amount 0 <= l(u,v) <= l
max(u,v) of power delivered by u to v. Let Con=Σ
uc(u) be the power consumed in the net. The problem is to compute the maximum value of Con.
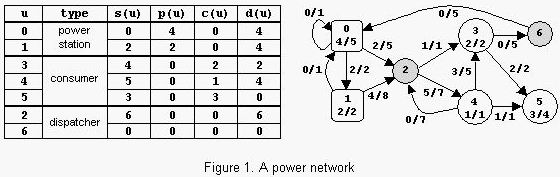
An example is in figure 1. The label x/y of power station u shows that p(u)=x and p max(u)=y. The label x/y of consumer u shows that c(u)=x and c max(u)=y. The label x/y of power transport line (u,v) shows that l(u,v)=x and l max(u,v)=y. The power consumed is Con=6. Notice that there are other possible states of the network but the value of Con cannot exceed 6.
An example is in figure 1. The label x/y of power station u shows that p(u)=x and p max(u)=y. The label x/y of consumer u shows that c(u)=x and c max(u)=y. The label x/y of power transport line (u,v) shows that l(u,v)=x and l max(u,v)=y. The power consumed is Con=6. Notice that there are other possible states of the network but the value of Con cannot exceed 6.
Input
There are several data sets in the input. Each data set encodes a power network. It starts with four integers: 0 <= n <= 100 (nodes), 0 <= np <= n (power stations), 0 <= nc <= n (consumers), and 0 <= m <= n^2 (power transport lines). Follow m data triplets (u,v)z, where u and v are node identifiers (starting from 0) and 0 <= z <= 1000 is the value of l
max(u,v). Follow np doublets (u)z, where u is the identifier of a power station and 0 <= z <= 10000 is the value of p
max(u). The data set ends with nc doublets (u)z, where u is the identifier of a consumer and 0 <= z <= 10000 is the value of c
max(u). All input numbers are integers. Except the (u,v)z triplets and the (u)z doublets, which do not contain white spaces, white spaces can occur freely in input. Input data terminate with an end of file and are correct.
Output
For each data set from the input, the program prints on the standard output the maximum amount of power that can be consumed in the corresponding network. Each result has an integral value and is printed from the beginning of a separate line.
Sample Input
2 1 1 2 (0,1)20 (1,0)10 (0)15 (1)20
7 2 3 13 (0,0)1 (0,1)2 (0,2)5 (1,0)1 (1,2)8 (2,3)1 (2,4)7
         (3,5)2 (3,6)5 (4,2)7 (4,3)5 (4,5)1 (6,0)5
         (0)5 (1)2 (3)2 (4)1 (5)4
Sample Output
15
6
Hint
The sample input contains two data sets. The first data set encodes a network with 2 nodes, power station 0 with pmax(0)=15 and consumer 1 with cmax(1)=20, and 2 power transport lines with lmax(0,1)=20 and lmax(1,0)=10. The maximum value of Con is 15. The second data set encodes the network from figure 1.
题意:n个结点,nc个用电点,对应一个最大用电量;np个发电站,对应一个最大发电量;m条电缆,对应一个最大传输量。求最后所有用电点的最大可用电量之和。
最大流建图,定一个源点,源点向发电站建边,权值为发电站对应的发电量;电缆建边,权值为电缆对应的传输量;用电点向汇点建边,权值为用电点对应的最大用电量。
#include <cstdio>
#include <iostream>
#include <algorithm>
#include <cstring>
#define maxn 105

using namespace std;

int n, np, nc, m;
int maps[maxn][maxn], q[maxn * maxn];
int d[maxn];//记录每个点所在的层

int BFS()//BFS分层,判断是否存在增广路
{
    memset(d, -1, sizeof(d));
    d[0] = 0;
    int f, r;
    f = 1;
    r = 1;
    q[r++] = 0;
    while(f < r)
    {
        int x = q[f++];
        for(int i = 1; i <= n + 1; i++)
        {
            if(d[i] < 0 && maps[x][i] > 0)
            {
                d[i] = d[x] + 1;
                q[r++] = i;
            }
        }
    }
    if(d[n + 1] > 0)
        return 1;
    else
        return 0;
}

int Find(int x, int v)//找出某一条增广路的最大流
{
    int a;
    if(x == n + 1)
        return v;
    for(int i = 1; i <= n + 1; i++)
    {
        if(maps[x][i] > 0 && d[i] == d[x] + 1 && (a = Find(i, min(v, maps[x][i]))))//x到i有流量 且 i是x的下一层 且 i到汇点存在最大流
        {
            maps[x][i] -= a;//增广路
            maps[i][x] += a;//回退边
            return a;
        }
    }
    return 0;
}


int main()
{
    int u, v, z;
    while(scanf("%d%d%d%d", &n, &np, &nc, &m) != EOF)
    {
        memset(maps, 0, sizeof(maps));
        for(int i = 0; i < m; i++)
        {
            scanf(" (%d,%d)%d", &u, &v, &z);
            maps[u + 1][v + 1] += z;
        }
        for(int i = 0; i < np; i++)
        {
            scanf(" (%d)%d", &u, &z);
            maps[0][u + 1] += z;
        }
        for(int i = 0; i < nc; i++)
        {
            scanf(" (%d)%d", &u, &z);
            maps[u + 1][n + 1] += z;
        }
        for(int i = 0; i <= n + 1; i++)
        {
            for(int j = 0; j <= n + 1; j++)
                printf("%d  ",maps[i][j]);
            printf("\n");
        }
        int ans = 0;
        int t = 0;
        while(BFS())//BFS搜索判断是否有从源点到汇点的通路
        {
            while(t = Find(0, 999999999))//查找增广路,求其最大流
                ans += t;
        }
        printf("%d\n", ans);
    }
}


 734
734

 被折叠的 条评论
为什么被折叠?
被折叠的 条评论
为什么被折叠?
 到【灌水乐园】发言


