代码:
const value = -0.25
option = {
title: [{
text: value * 100 + '%',
left: '44%',
top: '44%',
textStyle: {
fontSize: 36,
fontWeight: '600',
color: '#333',
textAlign: 'center'
}
}],
series: [
{
type: 'pie',
radius: ['50%', '43%'],
center: ['50%', '50%'],
min: 0,
max: 1,
data: [{
value: Math.floor((Math.abs(value) * 100)),
itemStyle: {
color: '#d0021b'
},
label: {
show: false
},
labelLine: {
normal: {
smooth: true,
lineStyle: {
width: 0
}
}
},
hoverAnimation: false
},
{
label: {
show: false
},
labelLine: {
normal: {
smooth: true,
lineStyle: {
width: 0
}
}
},
value: 100 - Math.floor((Math.abs(value) * 100)),
hoverAnimation: false,
itemStyle: {
color: '#e6e6e6',
emphasis: {
color: '#e6e6e6'
}
}
}
]
},
{
type: 'pie',
radius: ['80%', '72%'],
center: ['50%', '50%'],
data: [{
label: {
show: false
},
labelLine: {
normal: {
smooth: true,
lineStyle: {
width: 0
}
}
},
value: 0,
hoverAnimation: false,
itemStyle: {
color: '#e6e6e6',
emphasis: {
color: '#e6e6e6'
}
}
}]
}
]
}
if (value < 0) {
option.series[0].data[0].itemStyle = {
borderColor: '#d0021b',
color: '#fff'
}
} else {
option.series[0].data[0].itemStyle = {
color: '#d0021b'
}
}
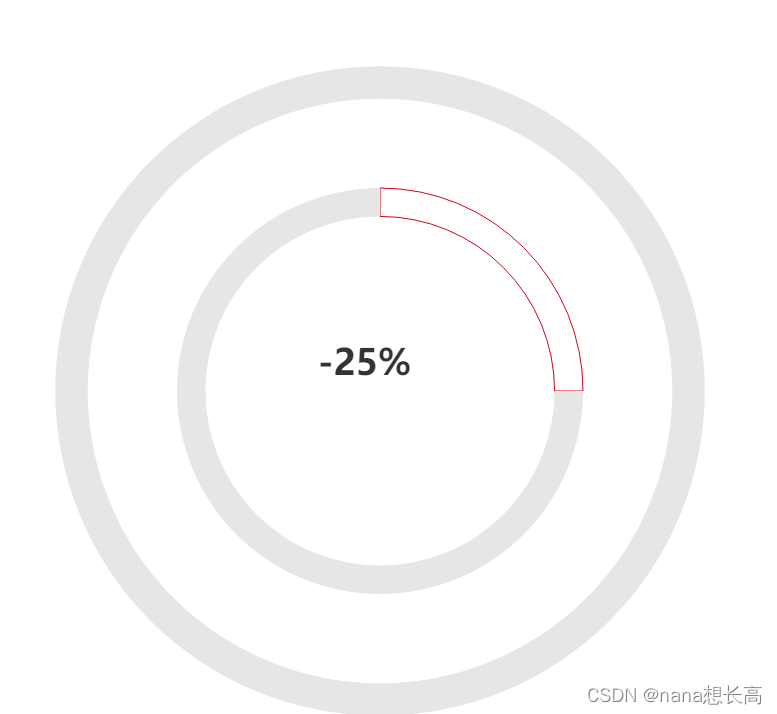
最终的效果:


 1394
1394


 被折叠的 条评论
为什么被折叠?
被折叠的 条评论
为什么被折叠?
 到【灌水乐园】发言


