


Python programmers will often suggest that there many ways the language can be used to solve a particular problem. But that some are more appropriate than others. The best solutions are celebrated as Idiomatic Python and there are lots of great examples of this on StackOverflow and other websites.
A sort of sub-language within Python, Pandas has its own set of idioms. We've alluded to some of these already, such as using vectorization whenever possible, and not using iterative loops if you don't need to. Several developers and users within the Panda's community have used the term pandorable for these idioms. I think it's a great term. So, I wanted to share with you a couple of key features of how you can make your code pandorable.
# Let's start by bringing in our data processing libraries
import pandas as pd
import numpy as np
# And we'll bring in some timing functionality too, from the timeit module
import timeit

# And lets look at some census data from the US
df = pd.read_csv('datasets/census.csv')
df.head()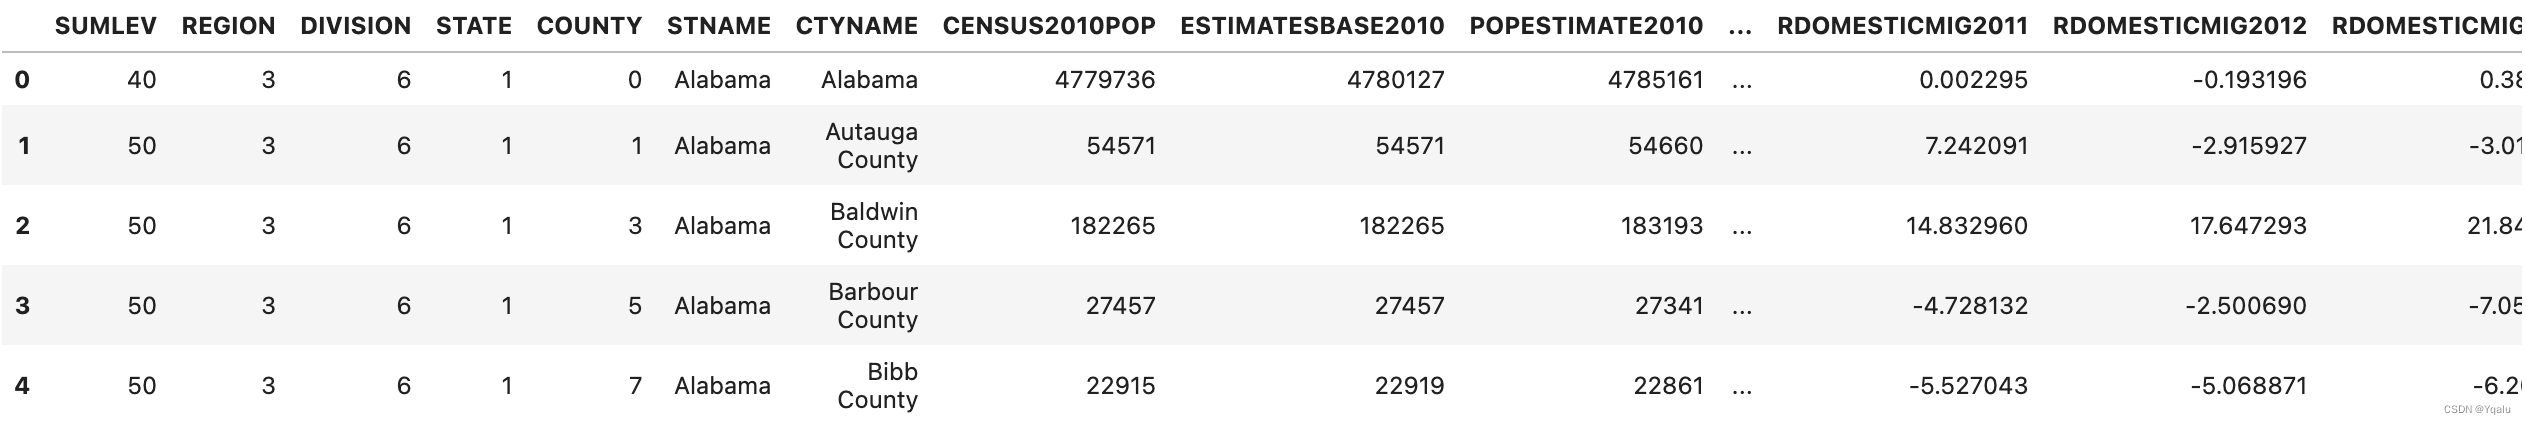
# The first of the pandas idioms I would like to talk about is called method chaining. The general idea behind
# method chaining is that every method on an object returns a reference to that object. The beauty of this is
# that you can condense many different operations on a DataFrame, for instance, into one line or at least one
# statement of code.

# Here's the pandorable way to write code with method chaining. In this code I'm going to pull out the state
# and city names as a multiple index, and I'm going to do so only for data which has a summary level of 50,
# which in this dataset is county-level data. I'll rename a column too, just to make it a bit more readable.
(df.where(df['SUMLEV']==50)
    .dropna()
    .set_index(['STNAME','CTYNAME'])
    .rename(columns={'ESTIMATESBASE2010': 'Estimates Base 2010'}))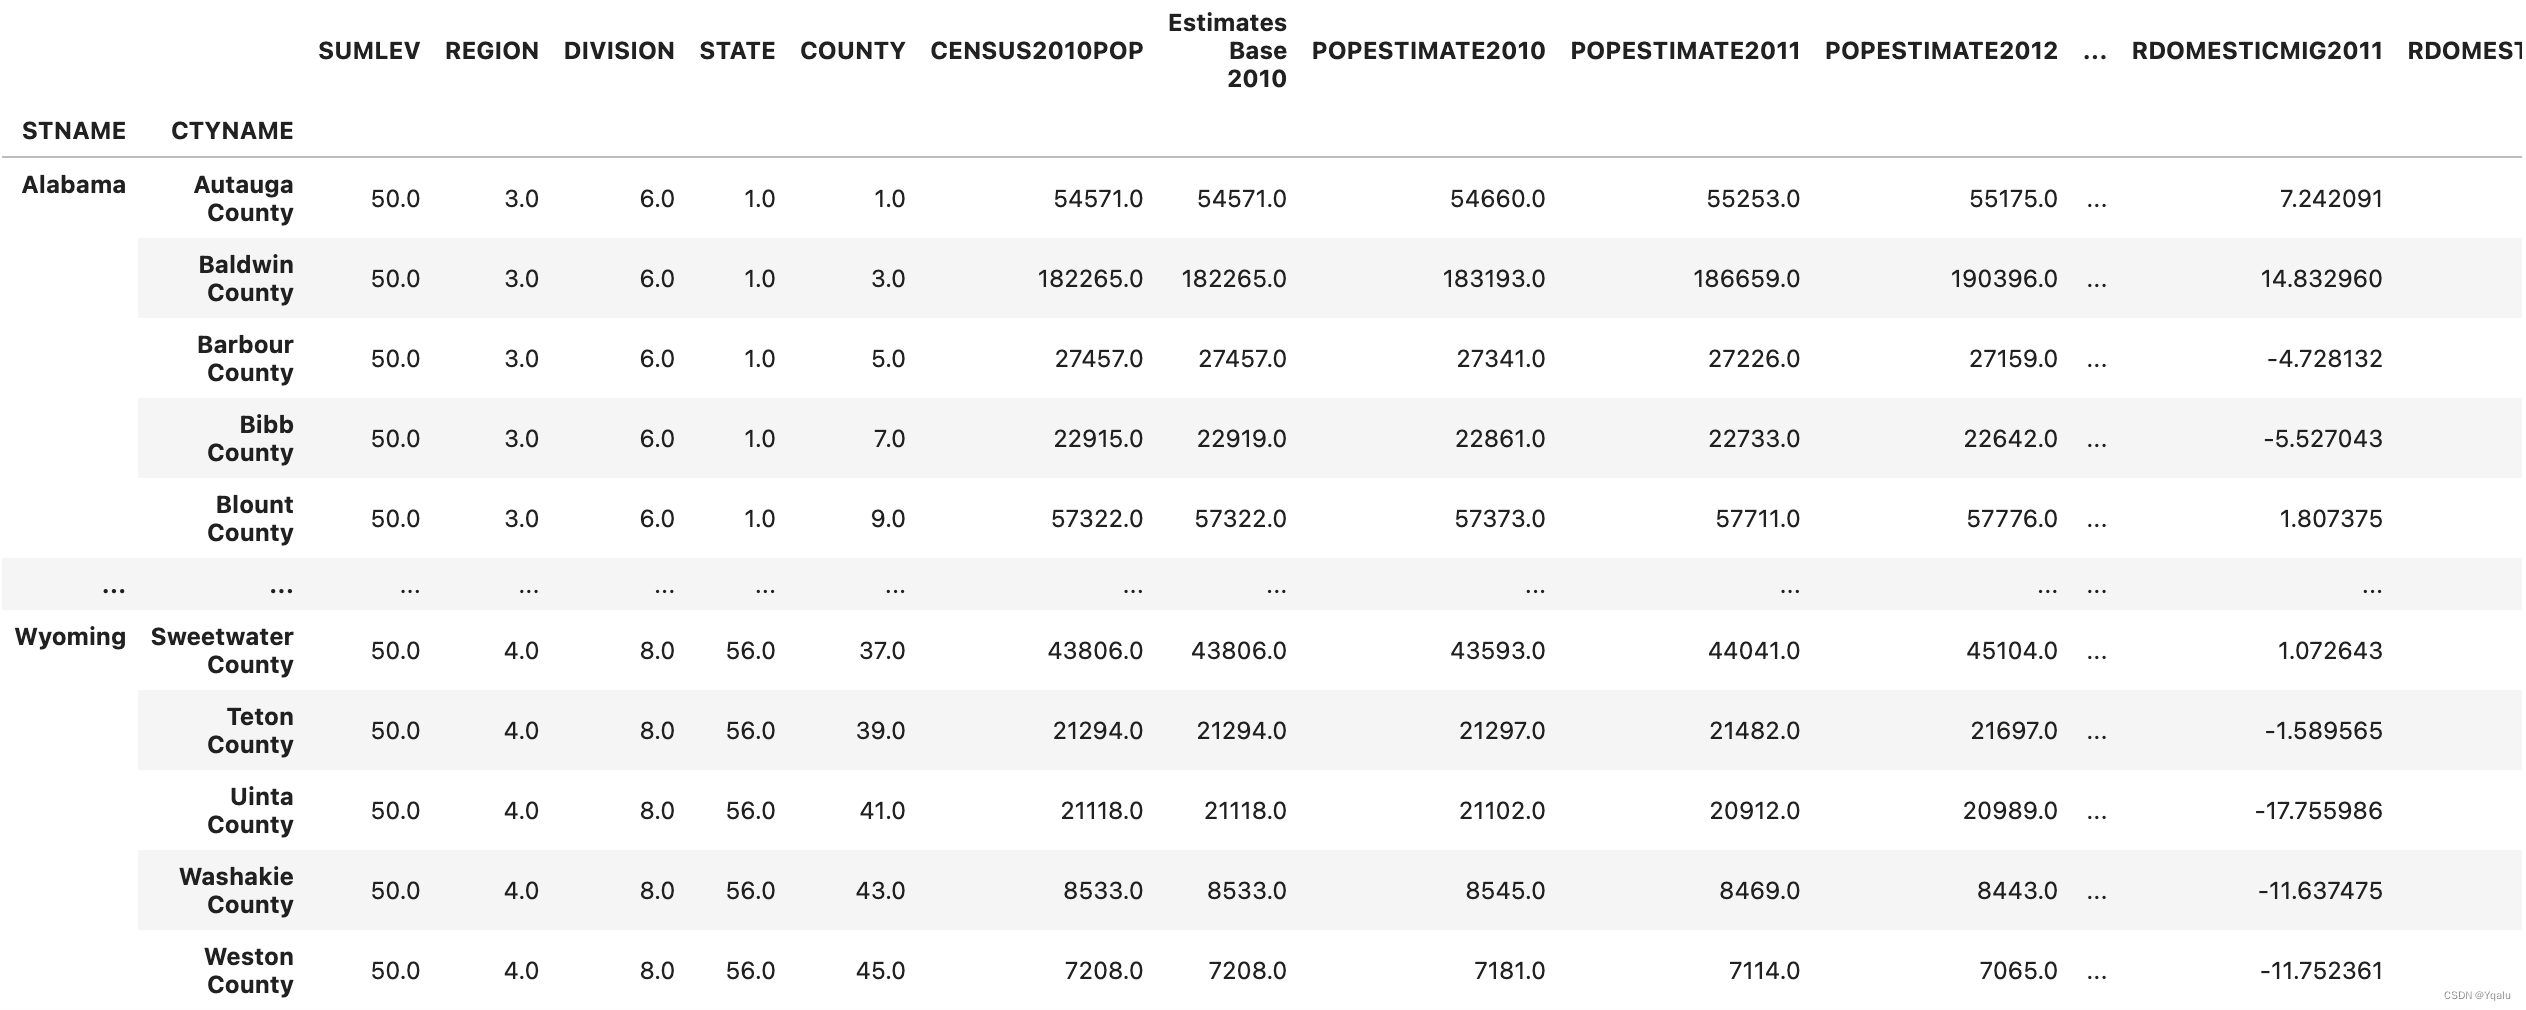
# Lets walk through this. First, we use the where() function on the dataframe and pass in a boolean mask which
# is only true for those rows where the SUMLEV is equal to 50. This indicates in our source data that the data
# is summarized at the county level. With the result of the where() function evaluated, we drop missing
# values. Remember that .where() doesn't drop missing values by default. Then we set an index on the result of
# that. In this case I've set it to the state name followed by the county name. Finally. I rename a column to
# make it more readable. Note that instead of writing this all on one line, as I could have done, I began the
# statement with a parenthesis, which tells python I'm going to span the statement over multiple lines for
# readability.

# Here's a more traditional, non-pandorable way, of writing this. There's nothing wrong with this code in the
# functional sense, you might even be able to understand it better as a new person to the language. It's just
# not as pandorable as the first example.

# First create a new dataframe from the original
df = df[df['SUMLEV']==50] # I'll use the overloaded indexing operator [] which drops nans
# Update the dataframe to have a new index, we use inplace=True to do this in place
df.set_index(['STNAME','CTYNAME'], inplace=True)
# Set the column names
df.rename(columns={'ESTIMATESBASE2010': 'Estimates Base 2010'})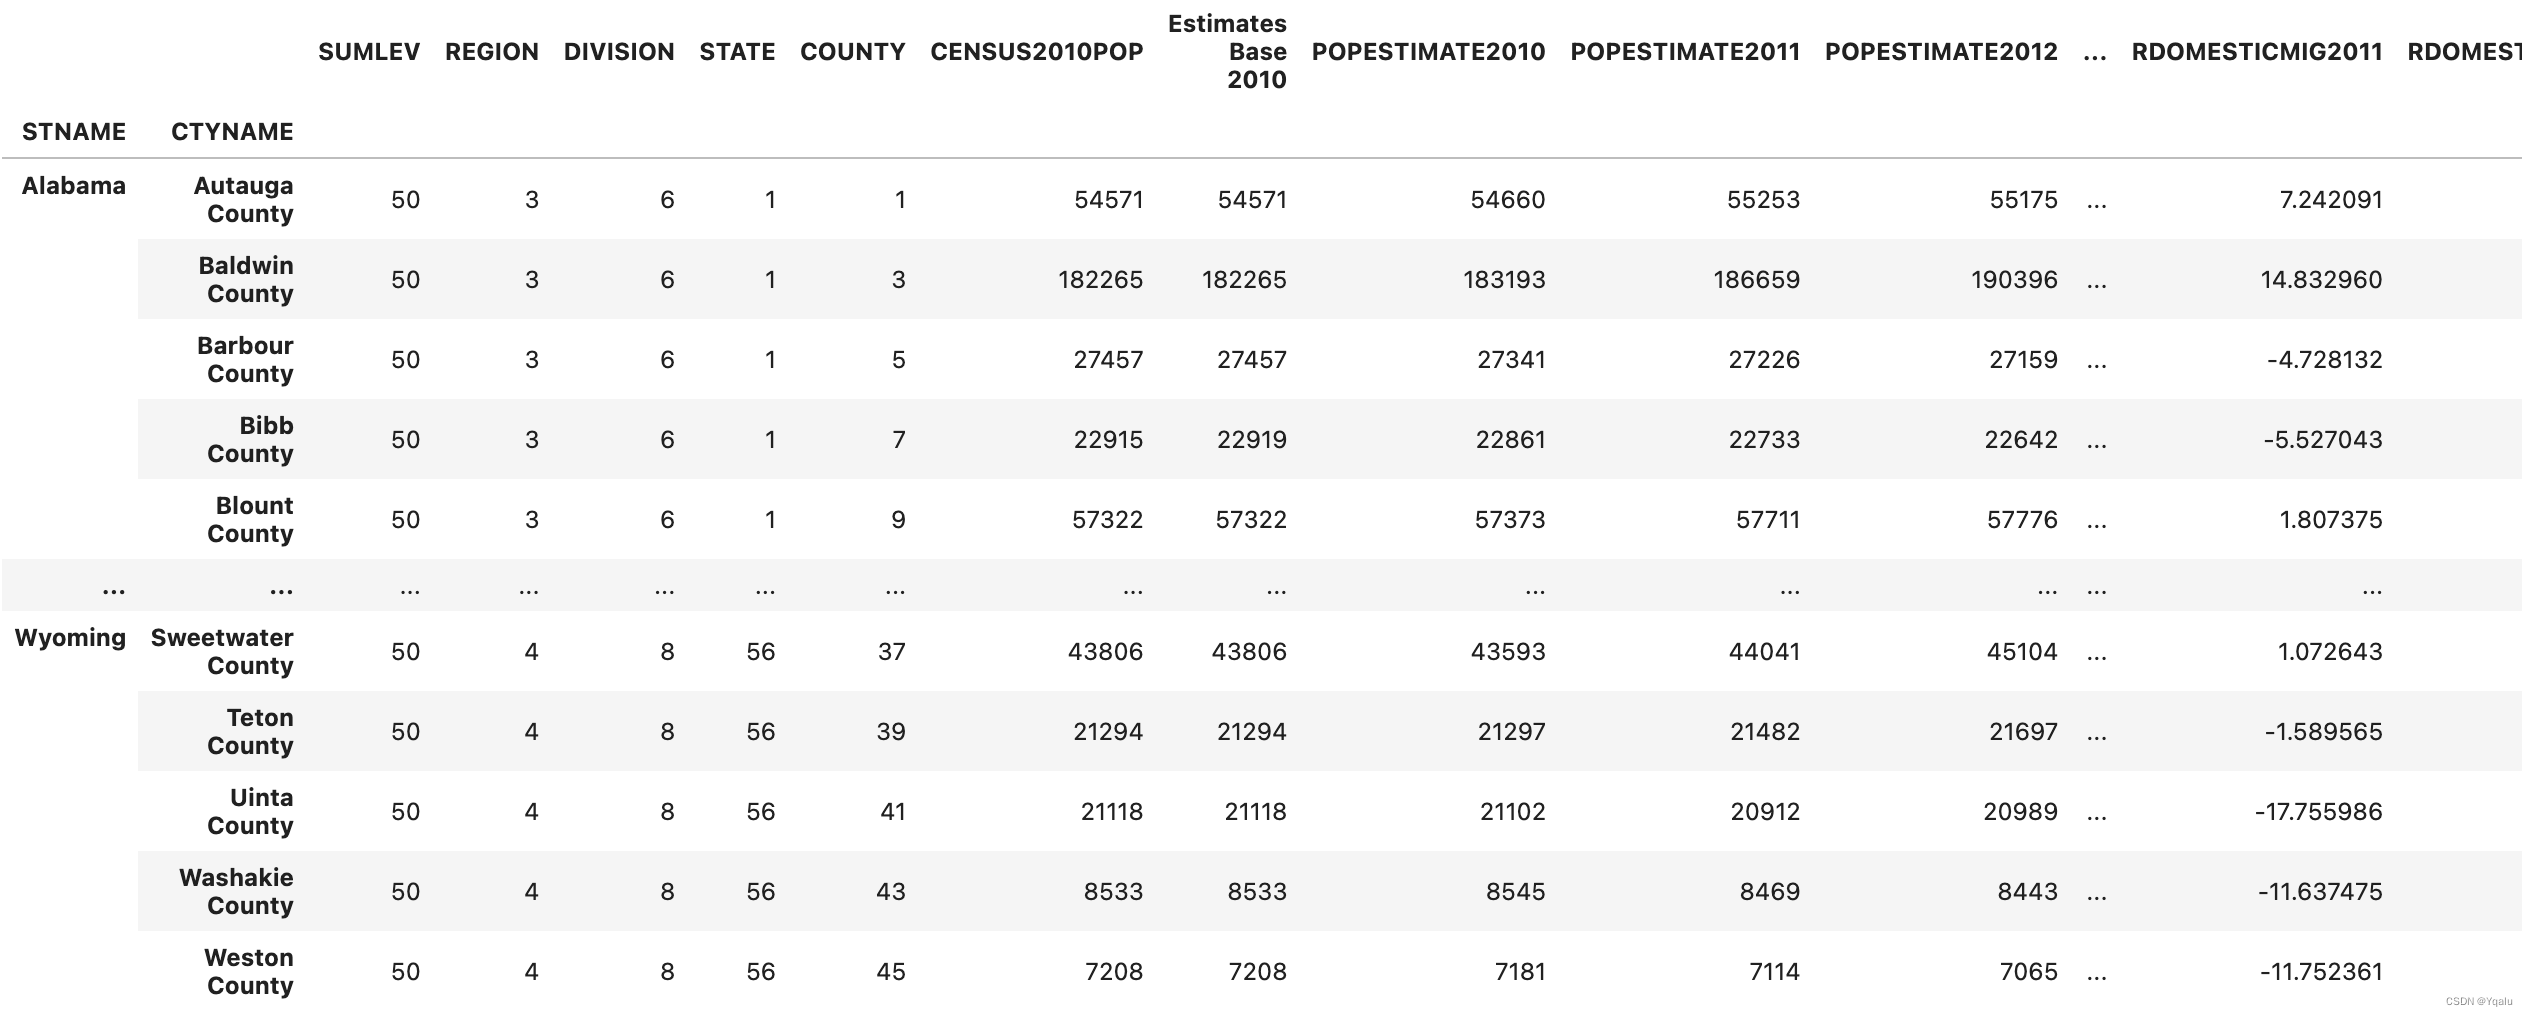
# Now, the key with any good idiom is to understand when it isn't helping you. In this case, you can actually
# time both methods and see which one runs faster

# We can put the approach into a function and pass the function into the timeit function to count the time the
# parameter number allows us to choose how many times we want to run the function. Here we will just set it to
# 10

# Lets write a wrapper for our first function
def first_approach():
    global df
    # And we'll just paste our code right here
    return (df.where(df['SUMLEV']==50)
             .dropna()
             .set_index(['STNAME','CTYNAME'])
             .rename(columns={'ESTIMATESBASE2010': 'Estimates Base 2010'}))

# Read in our dataset anew
df = pd.read_csv('datasets/census.csv')

# And now lets run it
timeit.timeit(first_approach, number=10)

>>> 0.4650543009629473

# Now let's test the second approach. As you may notice, we use our global variable df in the function.
# However, changing a global variable inside a function will modify the variable even in a global scope and we
# do not want that to happen in this case. Therefore, for selecting summary levels of 50 only, I create a new
# dataframe for those records

# Let's run this for once and see how fast it is
def second_approach():
    global df
    new_df = df[df['SUMLEV']==50]
    new_df.set_index(['STNAME','CTYNAME'], inplace=True)
    return new_df.rename(columns={'ESTIMATESBASE2010': 'Estimates Base 2010'})

# Read in our dataset anew
df = pd.read_csv('datasets/census.csv')

# And now lets run it
timeit.timeit(second_approach, number=10)

>>> 0.1295389300212264
# As you can see, the second approach is much faster! So, this is a particular example of a classic time
# readability trade off.
# You'll see lots of examples on stack overflow and in documentation of people using method chaining in their
# pandas. And so, I think being able to read and understand the syntax is really worth your time. But keep in
# mind that following what appears to be stylistic idioms might have performance issues that you need to
# consider as well.
# Here's another pandas idiom. Python has a wonderful function called map, which is sort of a basis for
# functional programming in the language. When you want to use map in Python, you pass it some function you
# want called, and some iterable, like a list, that you want the function to be applied to. The results are
# that the function is called against each item in the list, and there's a resulting list of all of the
# evaluations of that function.
# Pandas has a similar function called applymap. In applymap, you provide some function which should operate
# on each cell of a DataFrame, and the return set is itself a DataFrame. Now I think applymap is fine, but I
# actually rarely use it. Instead, I find myself often wanting to map across all of the rows in a DataFrame.
# And pandas has a function that I use heavily there, called apply. Let's look at an example.
# Let's take a look at our census DataFrame. In this DataFrame, we have five columns for population estimates,
# with each column corresponding with one year of estimates. It's quite reasonable to want to create some new
# columns for minimum or maximum values, and the apply function is an easy way to do this.
# First, we need to write a function which takes in a particular row of data, finds a minimum and maximum
# values, and returns a new row of data nd returns a new row of data. We'll call this function min_max, this
# is pretty straight forward. We can create some small slice of a row by projecting the population columns.
# Then use the NumPy min and max functions, and create a new series with a label values represent the new
# values we want to apply.
def min_max(row):
data = row[['POPESTIMATE2010',
'POPESTIMATE2011',
'POPESTIMATE2012',
'POPESTIMATE2013',
'POPESTIMATE2014',
'POPESTIMATE2015']]
return pd.Series({'min': np.min(data), 'max': np.max(data)})# Then we just need to call apply on the DataFrame.
# Apply takes the function and the axis on which to operate as parameters. Now, we have to be a bit careful,
# we've talked about axis zero being the rows of the DataFrame in the past. But this parameter is really the
# parameter of the index to use. So, to apply across all rows, which is applying on all columns, you pass axis
# equal to 'columns'.
df.apply(min_max, axis='columns').head()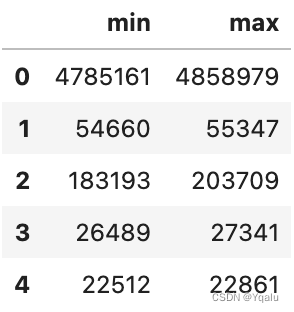
# Of course there's no need to limit yourself to returning a new series object. If you're doing this as part
# of data cleaning your likely to find yourself wanting to add new data to the existing DataFrame. In that
# case you just take the row values and add in new columns indicating the max and minimum scores. This is a
# regular part of my workflow when bringing in data and building summary or descriptive statistics, and is
# often used heavily with the merging of DataFrames.

# Here's an example where we have a revised version of the function min_max Instead of returning a separate
# series to display the min and max we add two new columns in the original dataframe to store min and max

def min_max(row):
    data = row[['POPESTIMATE2010',
                'POPESTIMATE2011',
                'POPESTIMATE2012',
                'POPESTIMATE2013',
                'POPESTIMATE2014',
                'POPESTIMATE2015']]
    # Create a new entry for max
    row['max'] = np.max(data)
    # Create a new entry for min
    row['min'] = np.min(data)
    return row
# Now just apply the function across the dataframe
df.apply(min_max, axis='columns')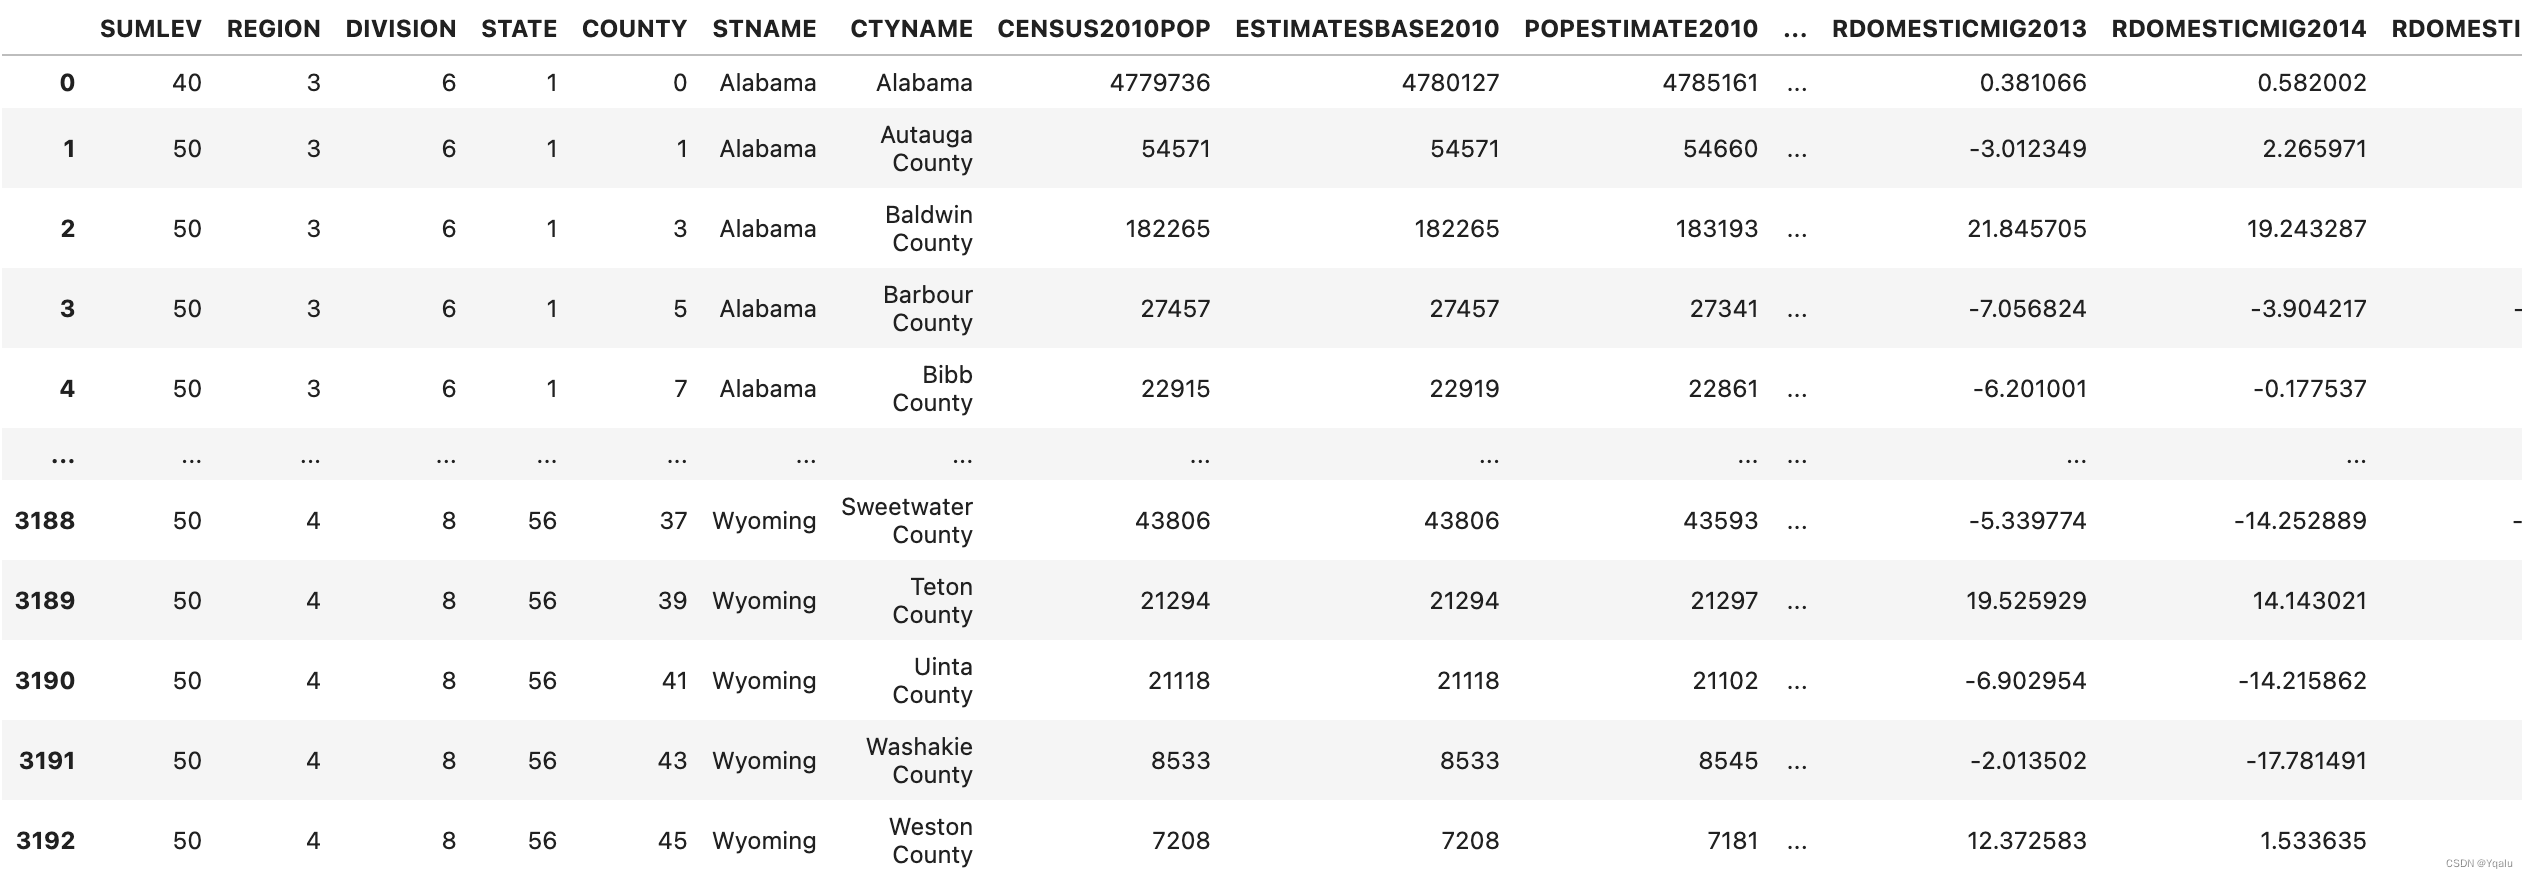
# Apply is an extremely important tool in your toolkit. The reason I introduced apply here is because you
# rarely see it used with large function definitions, like we did. Instead, you typically see it used with
# lambdas. To get the most of the discussions you'll see online, you're going to need to know how to at least
# read lambdas.

# Here's You can imagine how you might chain several apply calls with lambdas together to create a readable
# yet succinct data manipulation script. One line example of how you might calculate the max of the columns
# using the apply function.
rows = ['POPESTIMATE2010', 'POPESTIMATE2011', 'POPESTIMATE2012', 'POPESTIMATE2013','POPESTIMATE2014',
        'POPESTIMATE2015']
# Now we'll just apply this across the dataframe with a lambda
df.apply(lambda x: np.max(x[rows]), axis=1).head()

>>>
0    4858979
1      55347
2     203709
3      27341
4      22861
dtype: int64
# If you don't remember lambdas just pause the video for a moment and look up the syntax. A lambda is just an
# unnamed function in python, in this case it takes a single parameter, x, and returns a single value, in this
# case the maximum over all columns associated with row x.
# The beauty of the apply function is that it allows flexibility in doing whatever manipulation that you
# desire, as the function you pass into apply can be any customized however you want. Let's say we want to
# divide the states into four categories: Northeast, Midwest, South, and West We can write a customized
# function that returns the region based on the state the state regions information is obtained from Wikipedia
def get_state_region(x):
northeast = ['Connecticut', 'Maine', 'Massachusetts', 'New Hampshire',
'Rhode Island','Vermont','New York','New Jersey','Pennsylvania']
midwest = ['Illinois','Indiana','Michigan','Ohio','Wisconsin','Iowa',
'Kansas','Minnesota','Missouri','Nebraska','North Dakota',
'South Dakota']
south = ['Delaware','Florida','Georgia','Maryland','North Carolina',
'South Carolina','Virginia','District of Columbia','West Virginia',
'Alabama','Kentucky','Mississippi','Tennessee','Arkansas',
'Louisiana','Oklahoma','Texas']
west = ['Arizona','Colorado','Idaho','Montana','Nevada','New Mexico','Utah',
'Wyoming','Alaska','California','Hawaii','Oregon','Washington']
if x in northeast:
return "Northeast"
elif x in midwest:
return "Midwest"
elif x in south:
return "South"
else:
return "West"
# Now we have the customized function, let's say we want to create a new column called Region, which shows the
# state's region, we can use the customized function and the apply function to do so. The customized function
# is supposed to work on the state name column STNAME. So we will set the apply function on the state name
# column and pass the customized function into the apply function
df['state_region'] = df['STNAME'].apply(lambda x: get_state_region(x))
# Now let's see the results
df[['STNAME','state_region']].head()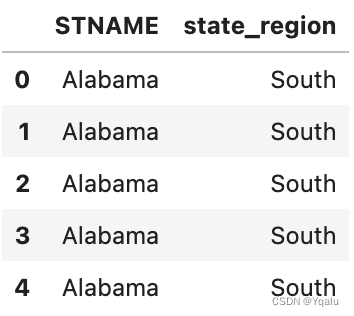
So there are a couple of Pandas idioms. But I think there's many more, and I haven't talked about them here. So here's an unofficial assignment for you. Go look at some of the top ranked questions on pandas on Stack Overflow, and look at how some of the more experienced authors, answer those questions. Do you see any interesting patterns? Feel free to share them with myself and others in the class.


 1万+
1万+


 被折叠的 条评论
为什么被折叠?
被折叠的 条评论
为什么被折叠?
 到【灌水乐园】发言


