


1. Introduction
To emphasize the problem of relying on a single metric such as accuracy for prediction, we’ll compare scenarios from different countries’ COVID-19 response.
1.1 Problem Setting
At the peak of the COVID-19 pandemic, hospital authorities had to make a call about who to admit and who to send home given the limited available resources. Our problem is to have a classifier that suggests whether a patient should be immediately admitted to the hospital or sent home.
The Data
The data use the following primary predictors:
- age
- sex
- cough, fever, chills, sore throat, headache, fatigue
The outcome is a classification prediction to indicate the urgency of admission.
- Positive: indicates a patient that was admitted within 1 day from the onset of symptoms.
- Negative: indicates everyone else.
Issues
While this case study tries to mimic a real-life problem, it is important to note that this analysis is for educational purposes only.
- The data is sourced through online forms and thus is of questionable accuracy.
- A large portion of the original dataset collected had missing values. This was ignored for a simpler analysis.
- The entire premise of predicting urgency of admission is false because some people had to wait longer to be admitted because of lack of hospital beds and resources.
For this problem setting, we examine two different models: Logistic Regression and kNN Classification. The goal is to train both these models and report the accuracy.
2. Why is accuracy not enought?
2.1 Which model is best?
For the two models (Logistic Regression and kNN Classification) trained previously, we can now compute the values for each metric discussed.
Why is accuracy not enough?
- Imbalanced data: If one class has 99% of the data then a simple model that predicts that class would give us 99% accuracy. Though this indicates that the model trained has high performance, in reality this is not ideal.
- There exist different mistakes for different classes. It is difficult to distinguish between these mistakes.
- Utility: Is accuracy the metric I care about the most?
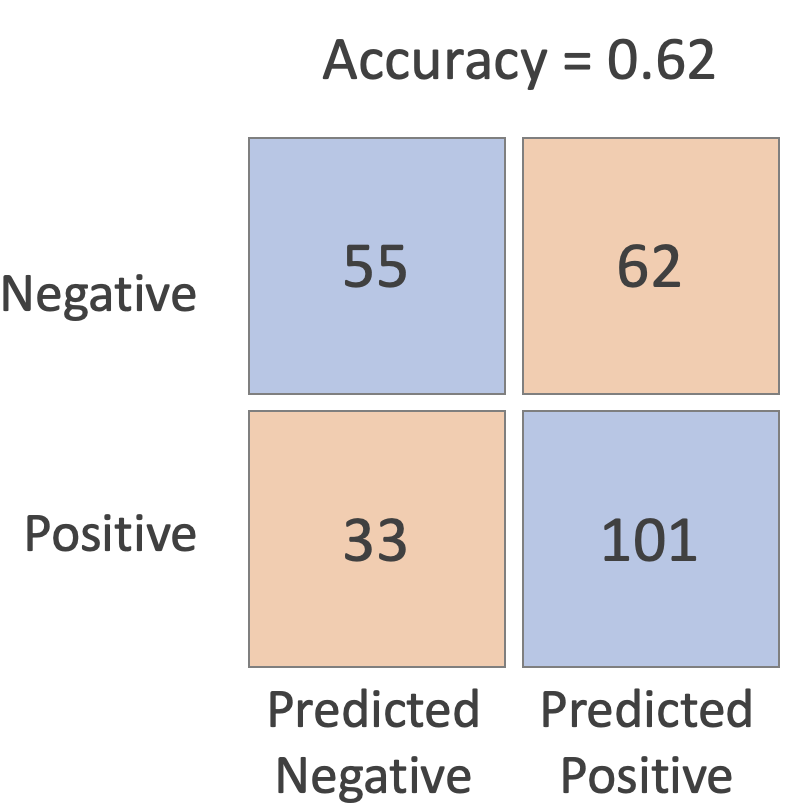
The Confusion Matrix
The Confusion Matrix shows the number of correct and incorrect predictions for each class, arranging them by True Negative (upper left), False Positive (upper right), False Negative (bottom left), and False Positive (bottom right).
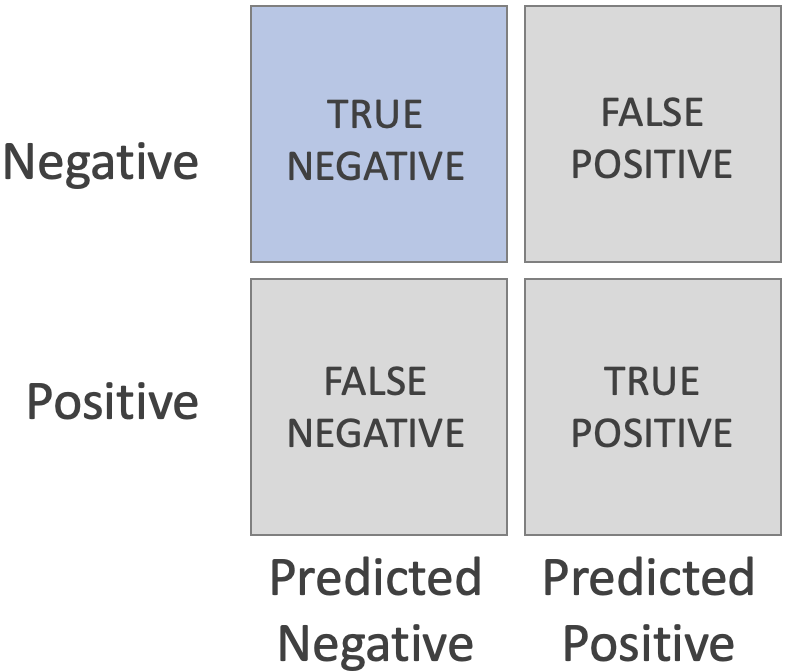
TRUE NEGATIVE (TN)
- Samples that are negative and that the classifier predicts as negative are called True Negatives.
- Example: a negative COVID test result would be a TRUE NEGATIVE if you actually don't have COVID.
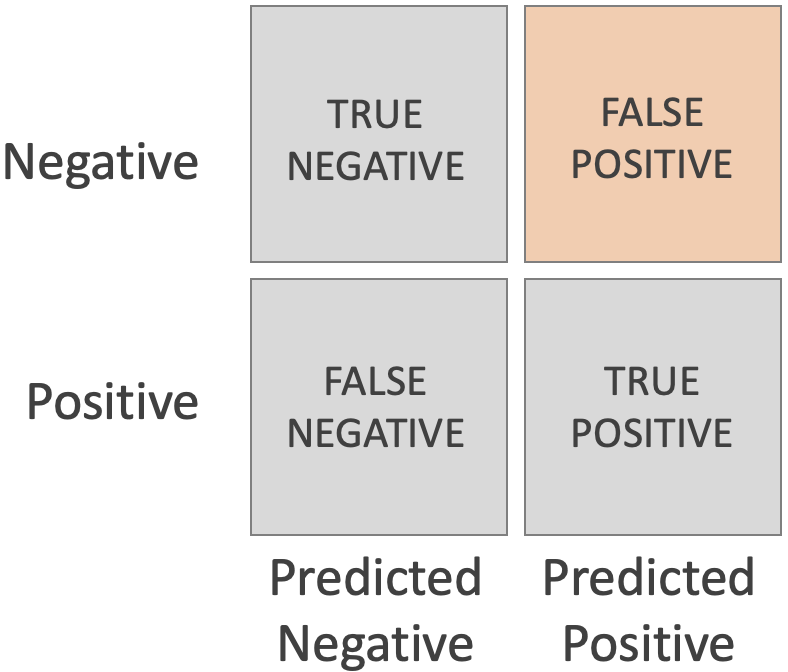
FALSE POSITIVE (FP)
- Samples that are negative and that the classifier predicts as positive are called False Positives.
- Example: a positive COVID test result would be a FALSE POSITIVE if you actually don't have COVID.

FALSE NEGATIVE (FN)
- Samples that are negative and that the classifier predicts as positive are called False Negatives.
- Example: a negative COVID test result would be a FALSE NEGATIVE if you actually have COVID.
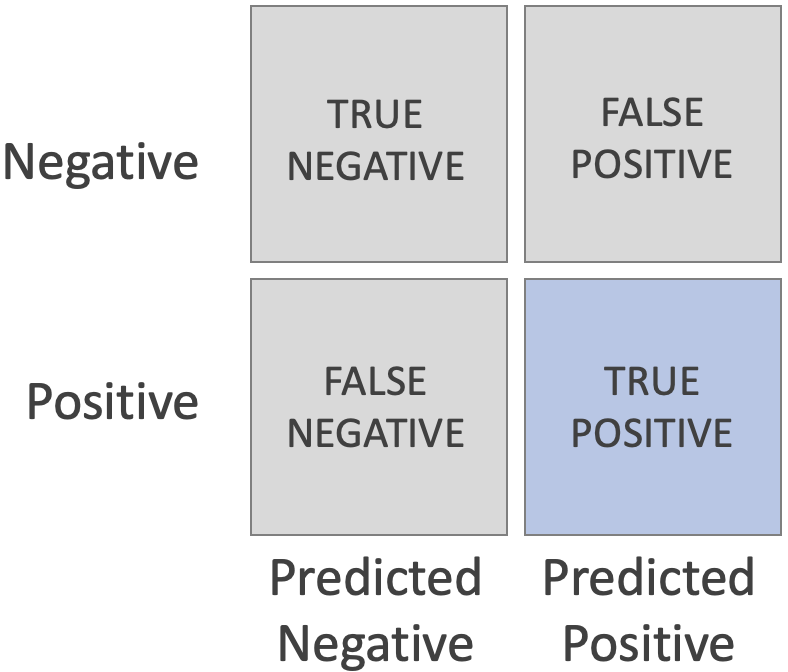
TRUE POSITIVE (TP)
- Samples that are positive and that the classifier predicts as positive are called True Positives.
- Example: a positive COVID test result would be a TRUE POSITIVE if you actually have COVID.
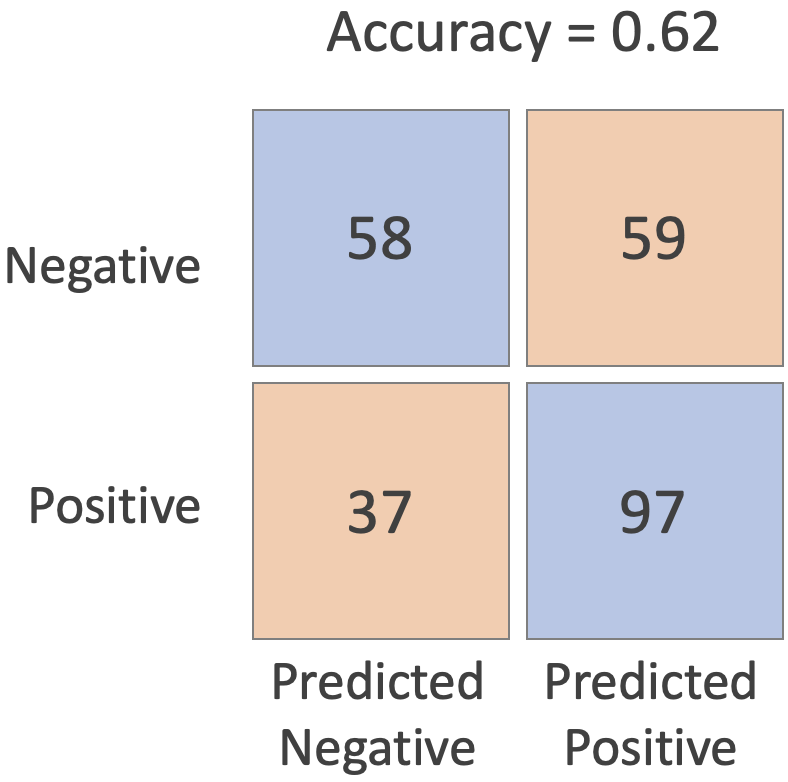
Confusion matrix results
The confusion matrix for each class in the prediction vs. the true label for Logistic Regression has results as follows:
The confusion matrix for each class the prediction vs. the true label for kNN Classification has results as follows:
Both models have slightly different confusion matrices, but identical accuracies.
Measurements
ACCURACY can be expressed in terms of different parts of the confusion matrix as follows:
SENSITIVITY or RECALL or TRUE POSITIVE RATE: This metric helps to examine how we do on the actual TRUE samples:
FALSE NEGATIVE RATE is used for the same purpose as the previous metric.
TRUE NEGATIVE RATE: This metric helps us examine how we do on the actual FALSE samples.
FALSE NEGATIVE RATE is used for the same purpose as the previous metric.
PRECISION is used to evaluate how we do when we predict TRUE.
F-1 SCORE is a score that tries to capture all is the F-1 score which is really appropriate for imbalanced datasets.
Based on these formulae, the accuracy for the logistic regression model is 0.62 - and the accuracy for the kNN classification model is also 0.62.
3. Bayes Threshold
For the two models (Logistic Regression and kNN Classification) trained previously, we can now compute the values for each metric discussed.
| Classification Metric | Formula | Logistic Regression | kNN Classification |
|---|---|---|---|
| Accuracy | 62% | 62% | |
| Sensitivity/Recall/TPR | 72% | 75% | |
| Specificity/TNR | 50% | 47% | |
| Precision | 62% | 62% | |
| F1 Score | 67% | 68% |
3.1 Bayes threshold
All of these metrics are based on classification. The models return probabilities which we turn into classifications by introducing a threshold, the Bayes threshold.
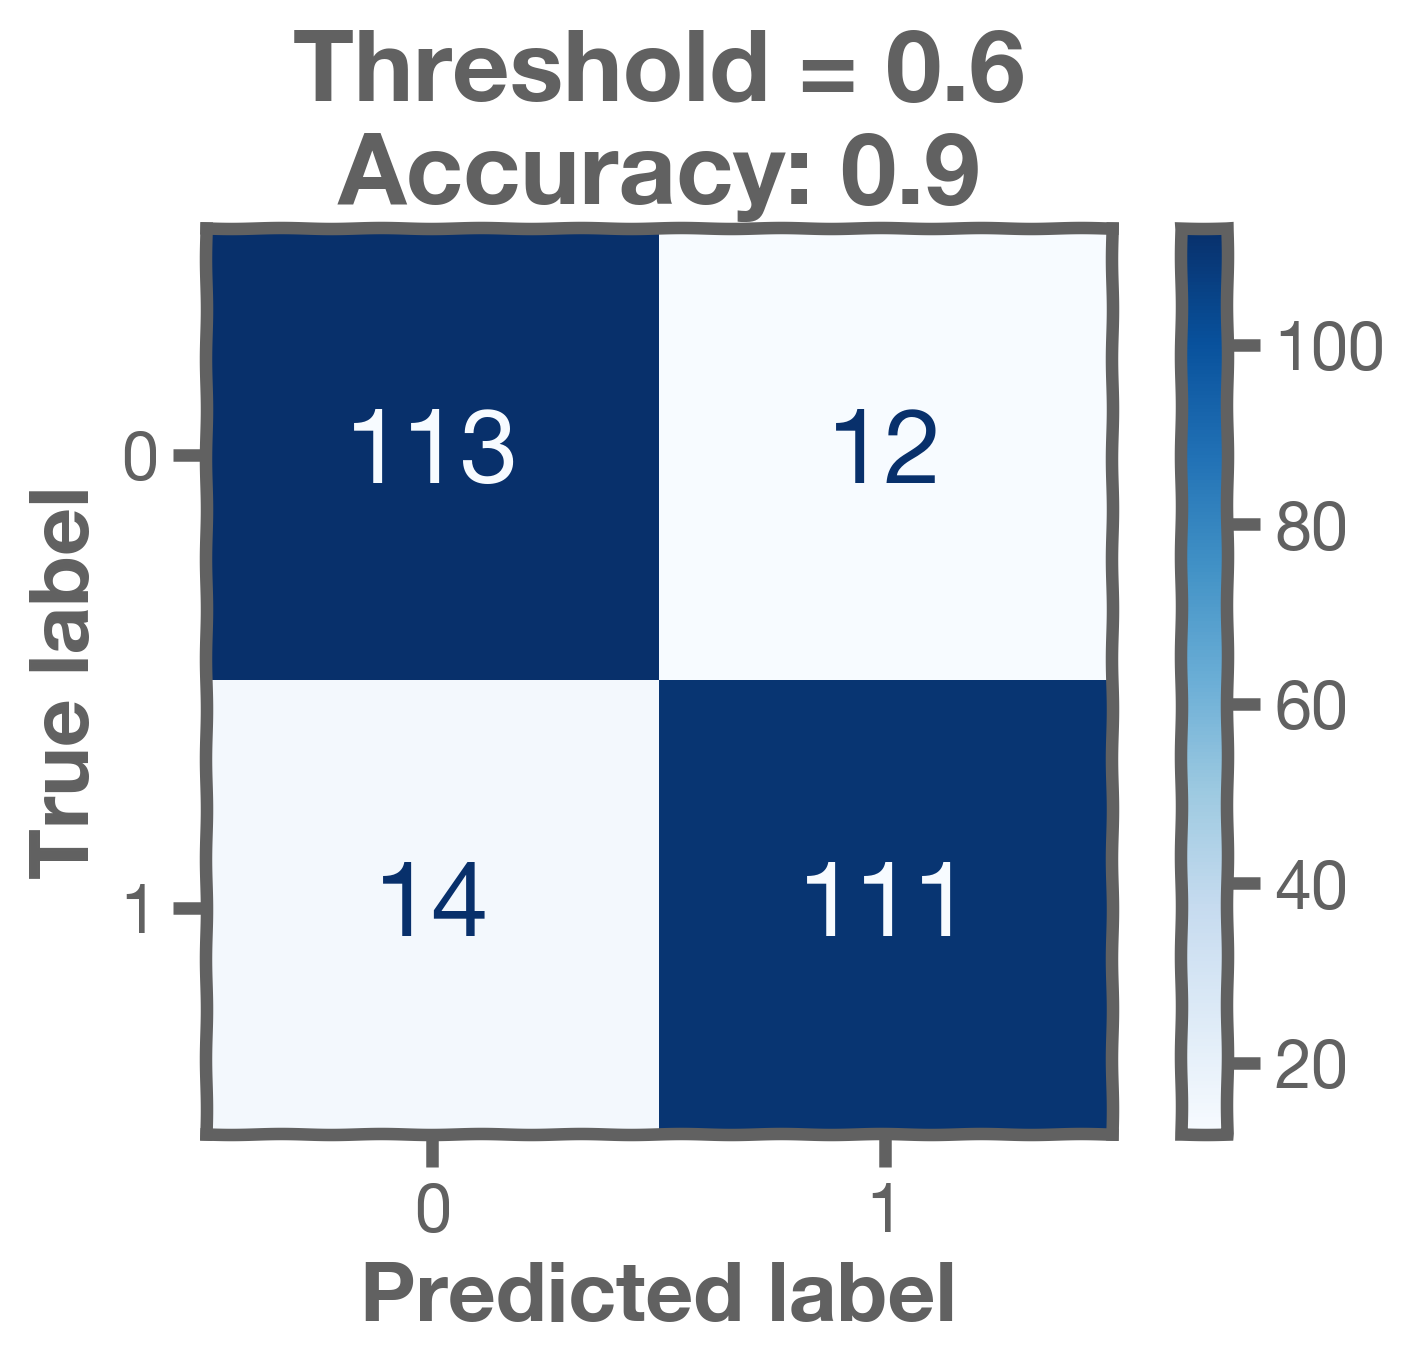
EXAMPLE:
We decide that a probability threshold of implies a decision of
(that is, a "yes" value).
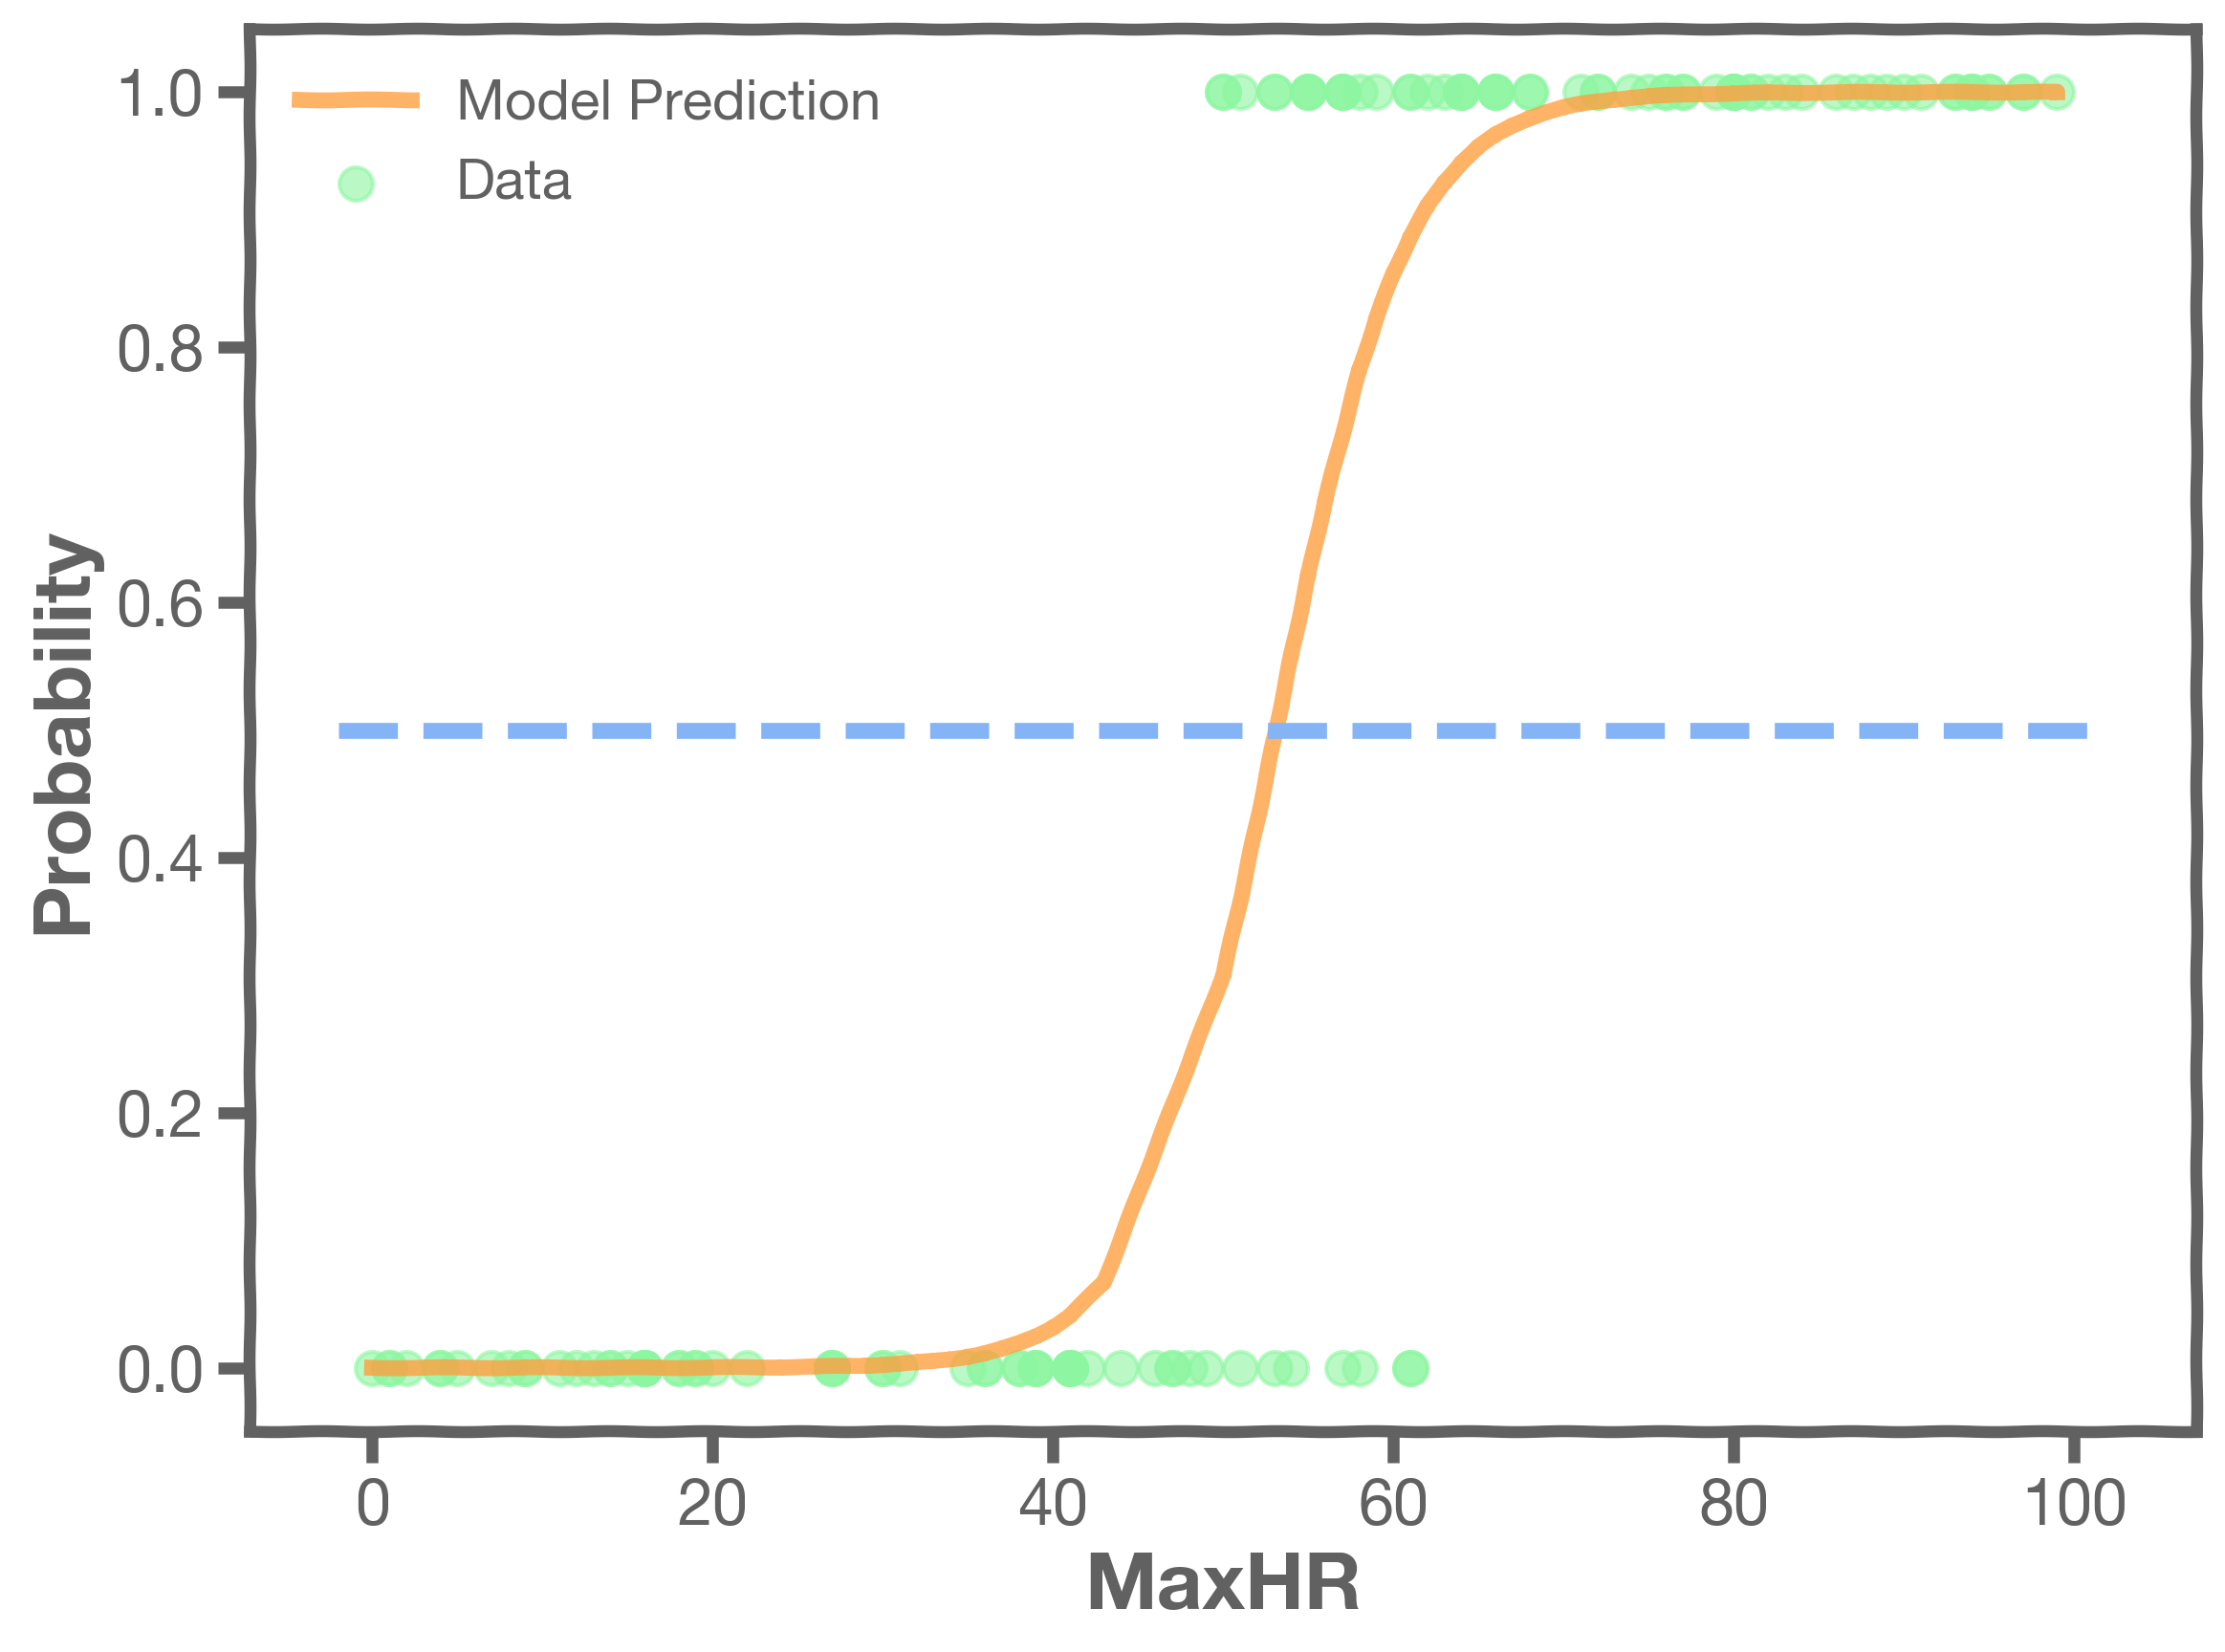
This threshold results in a confusion matrix as follows:
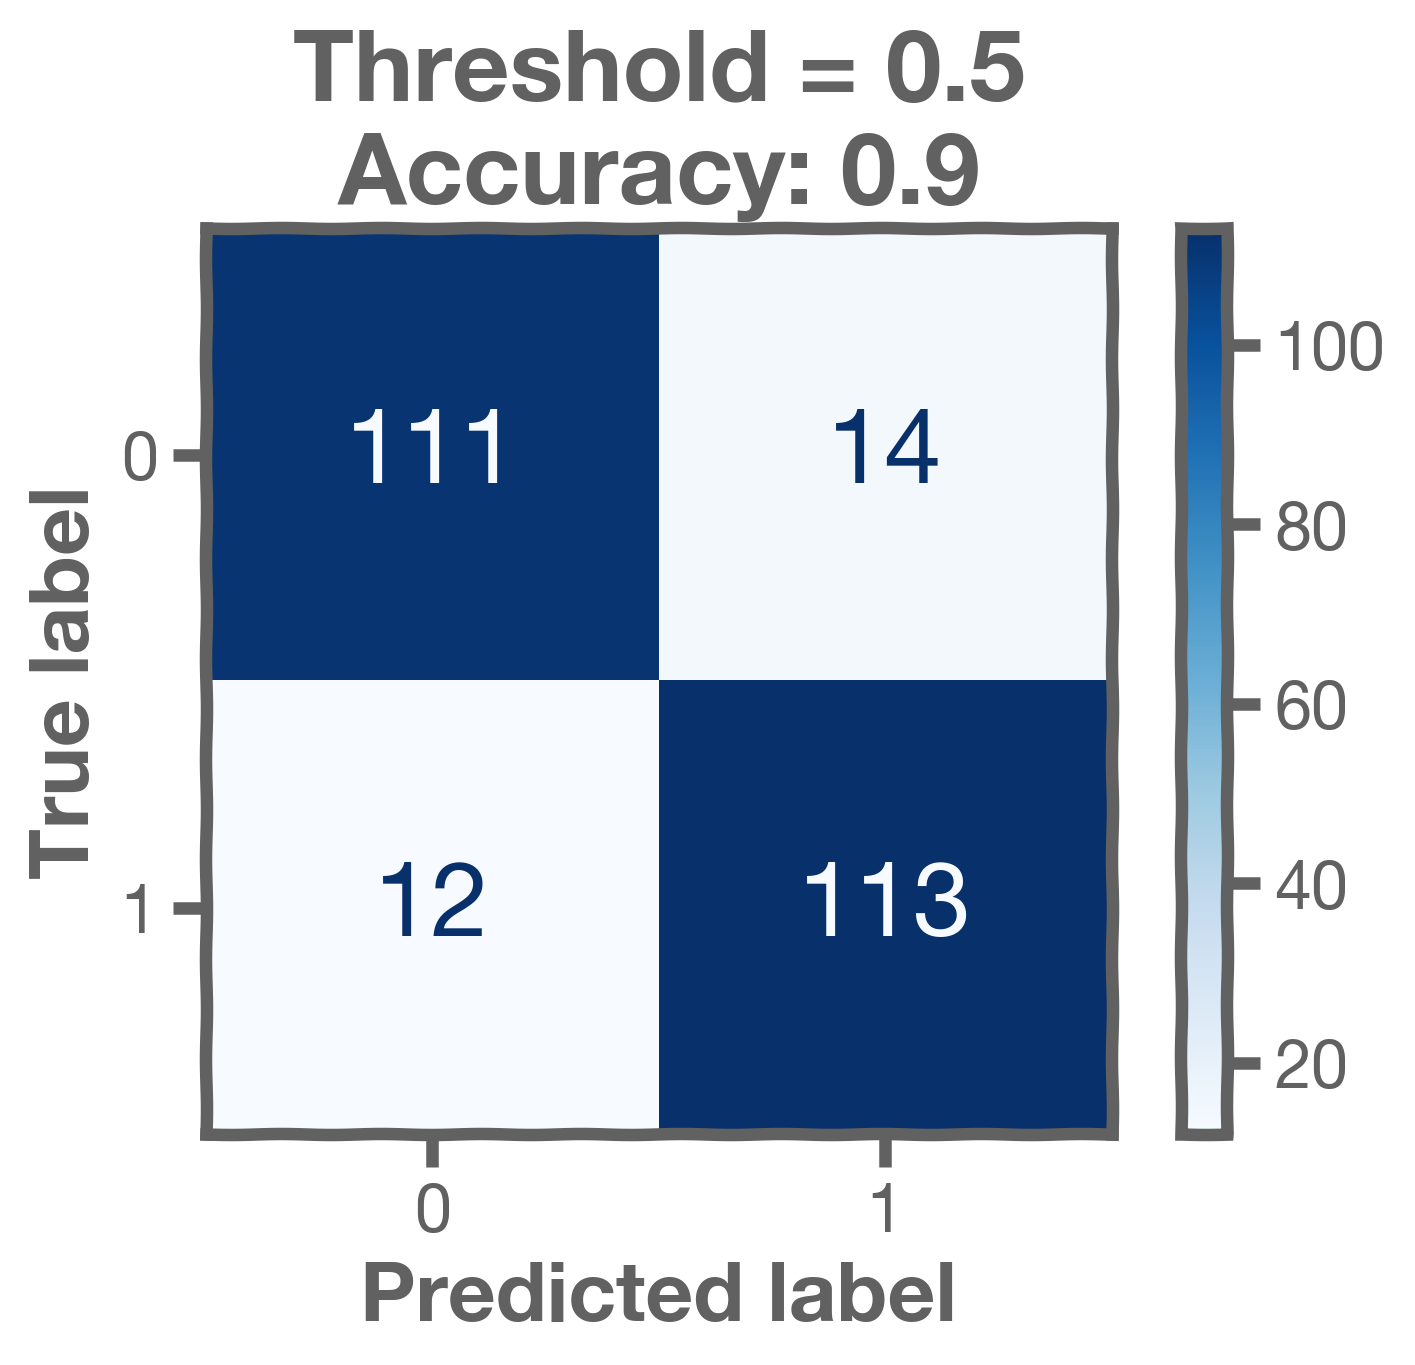
If we change that threshold, the elements on the confusion matrix change. If we increase it, we predict fewer positives and more negatives. Here is the case for .
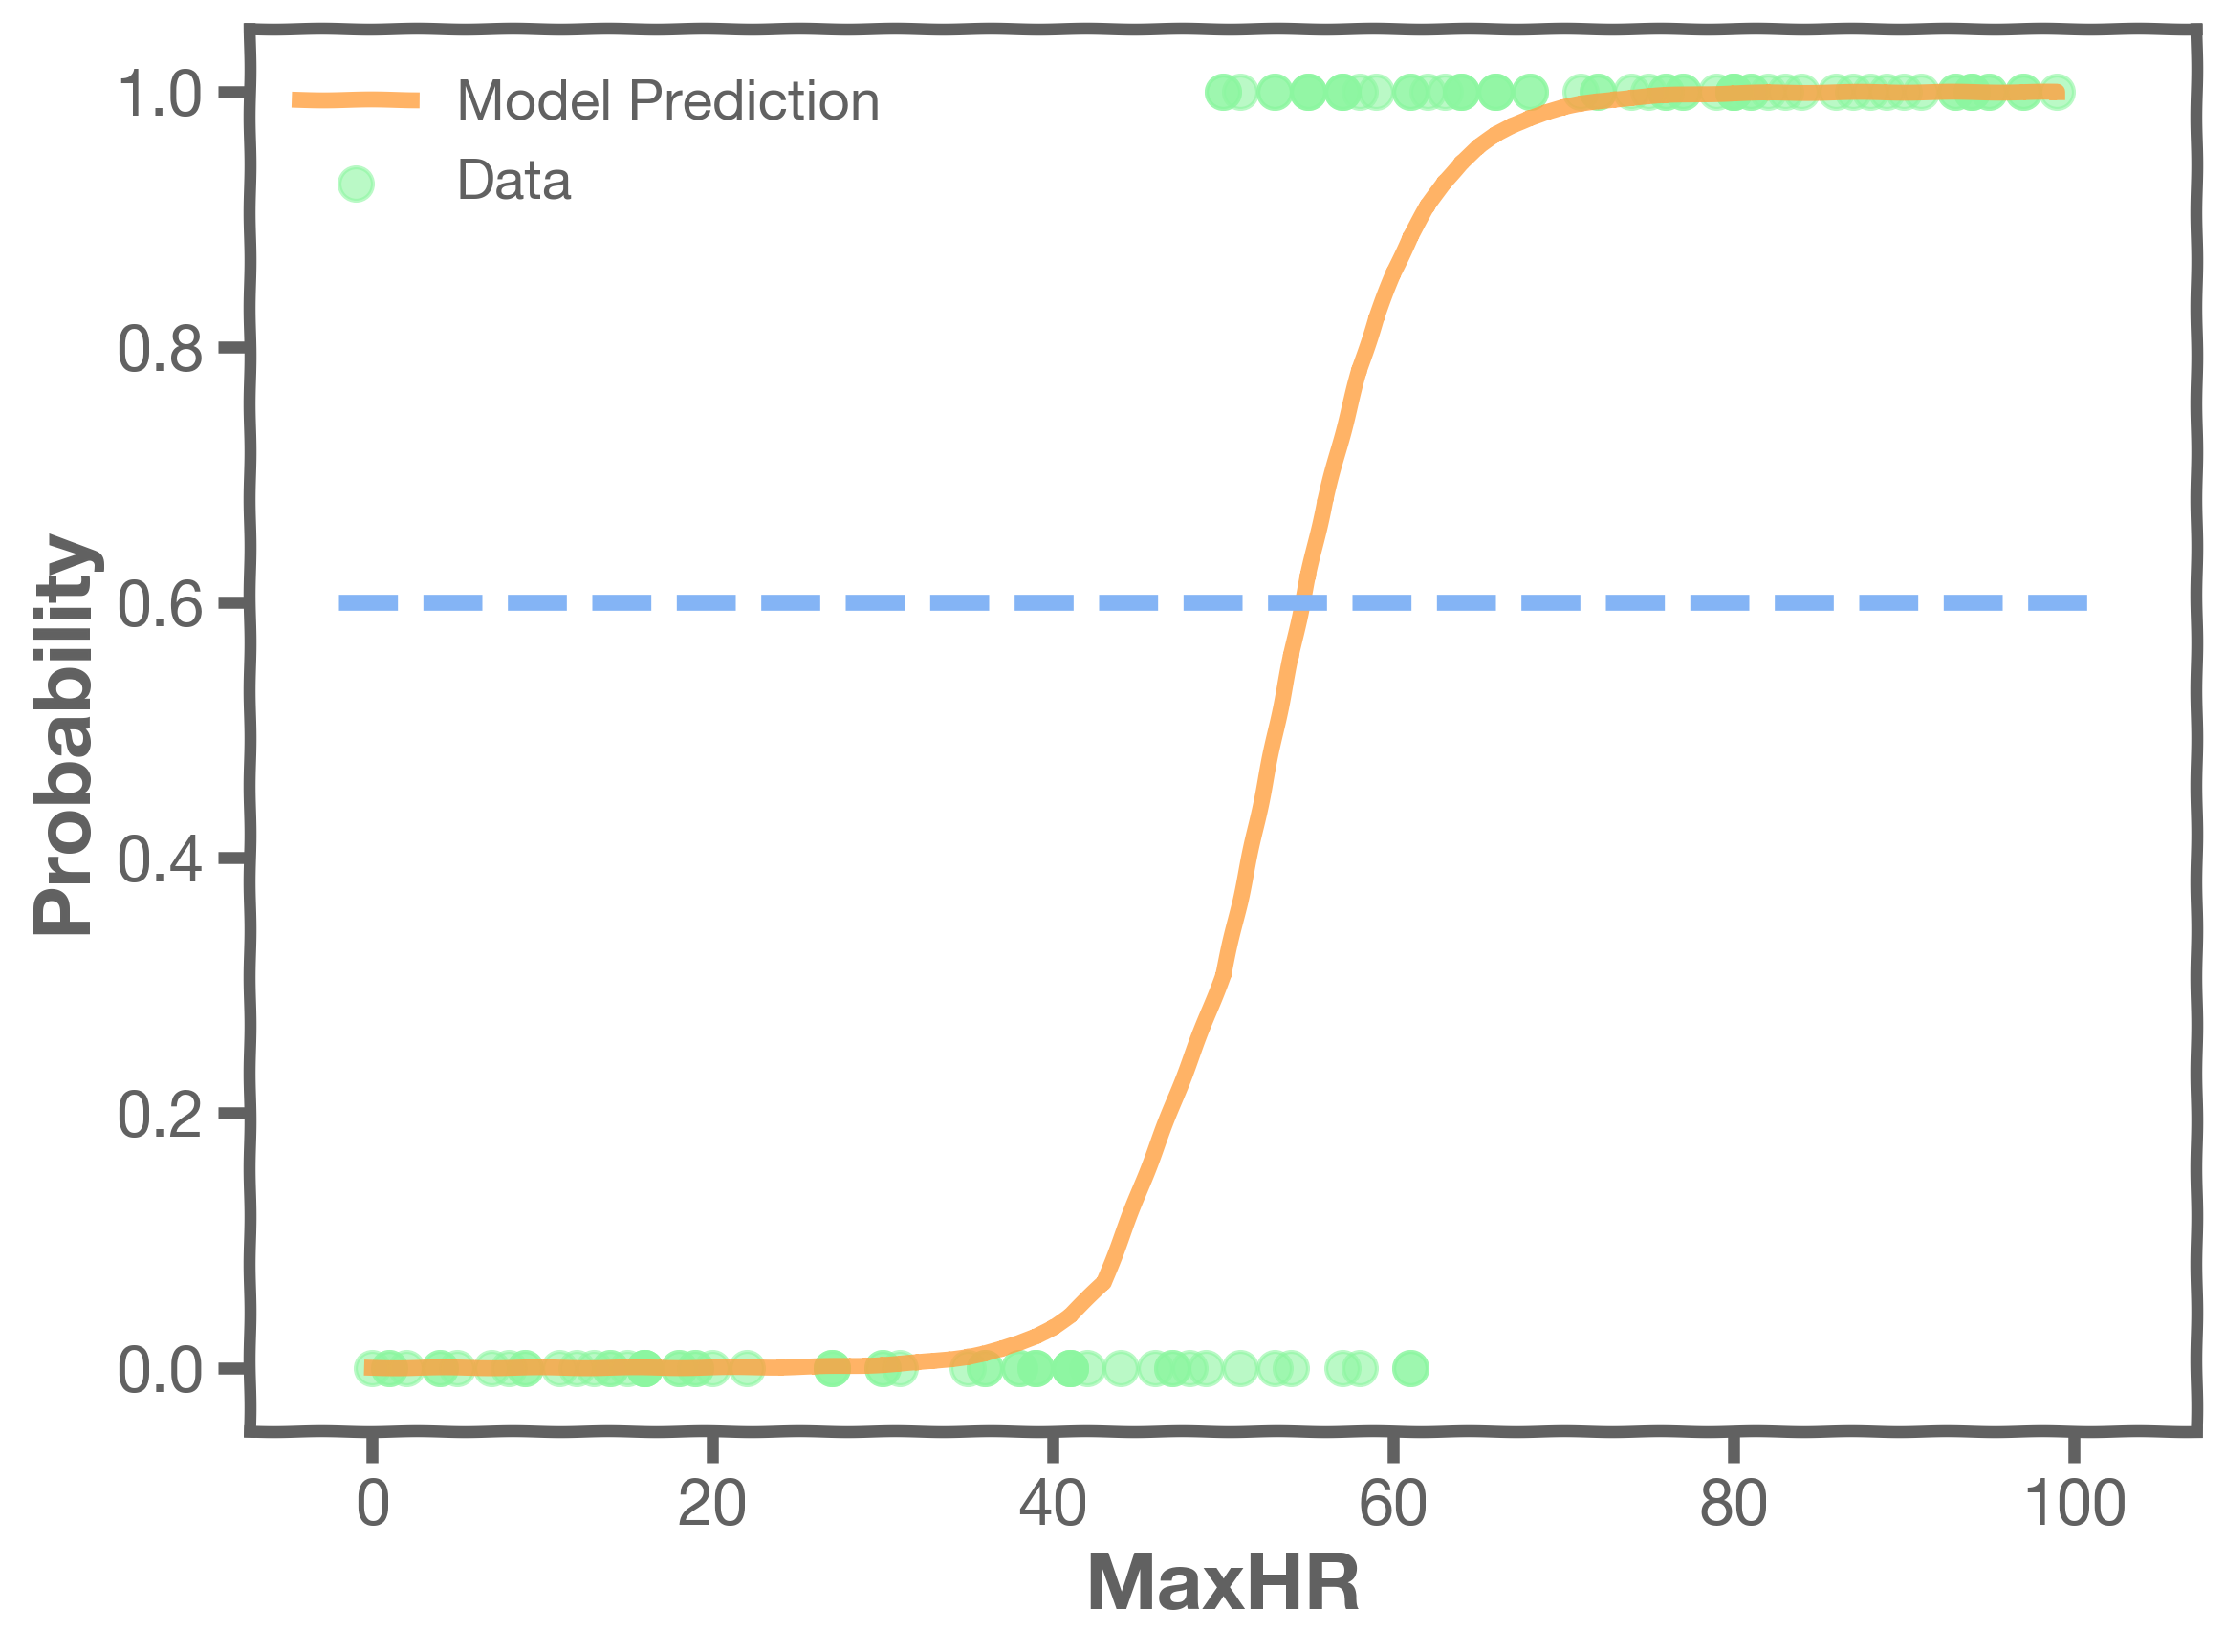
If the threshold is decreased, then we predict more positives and less negatives. Here is the case for .


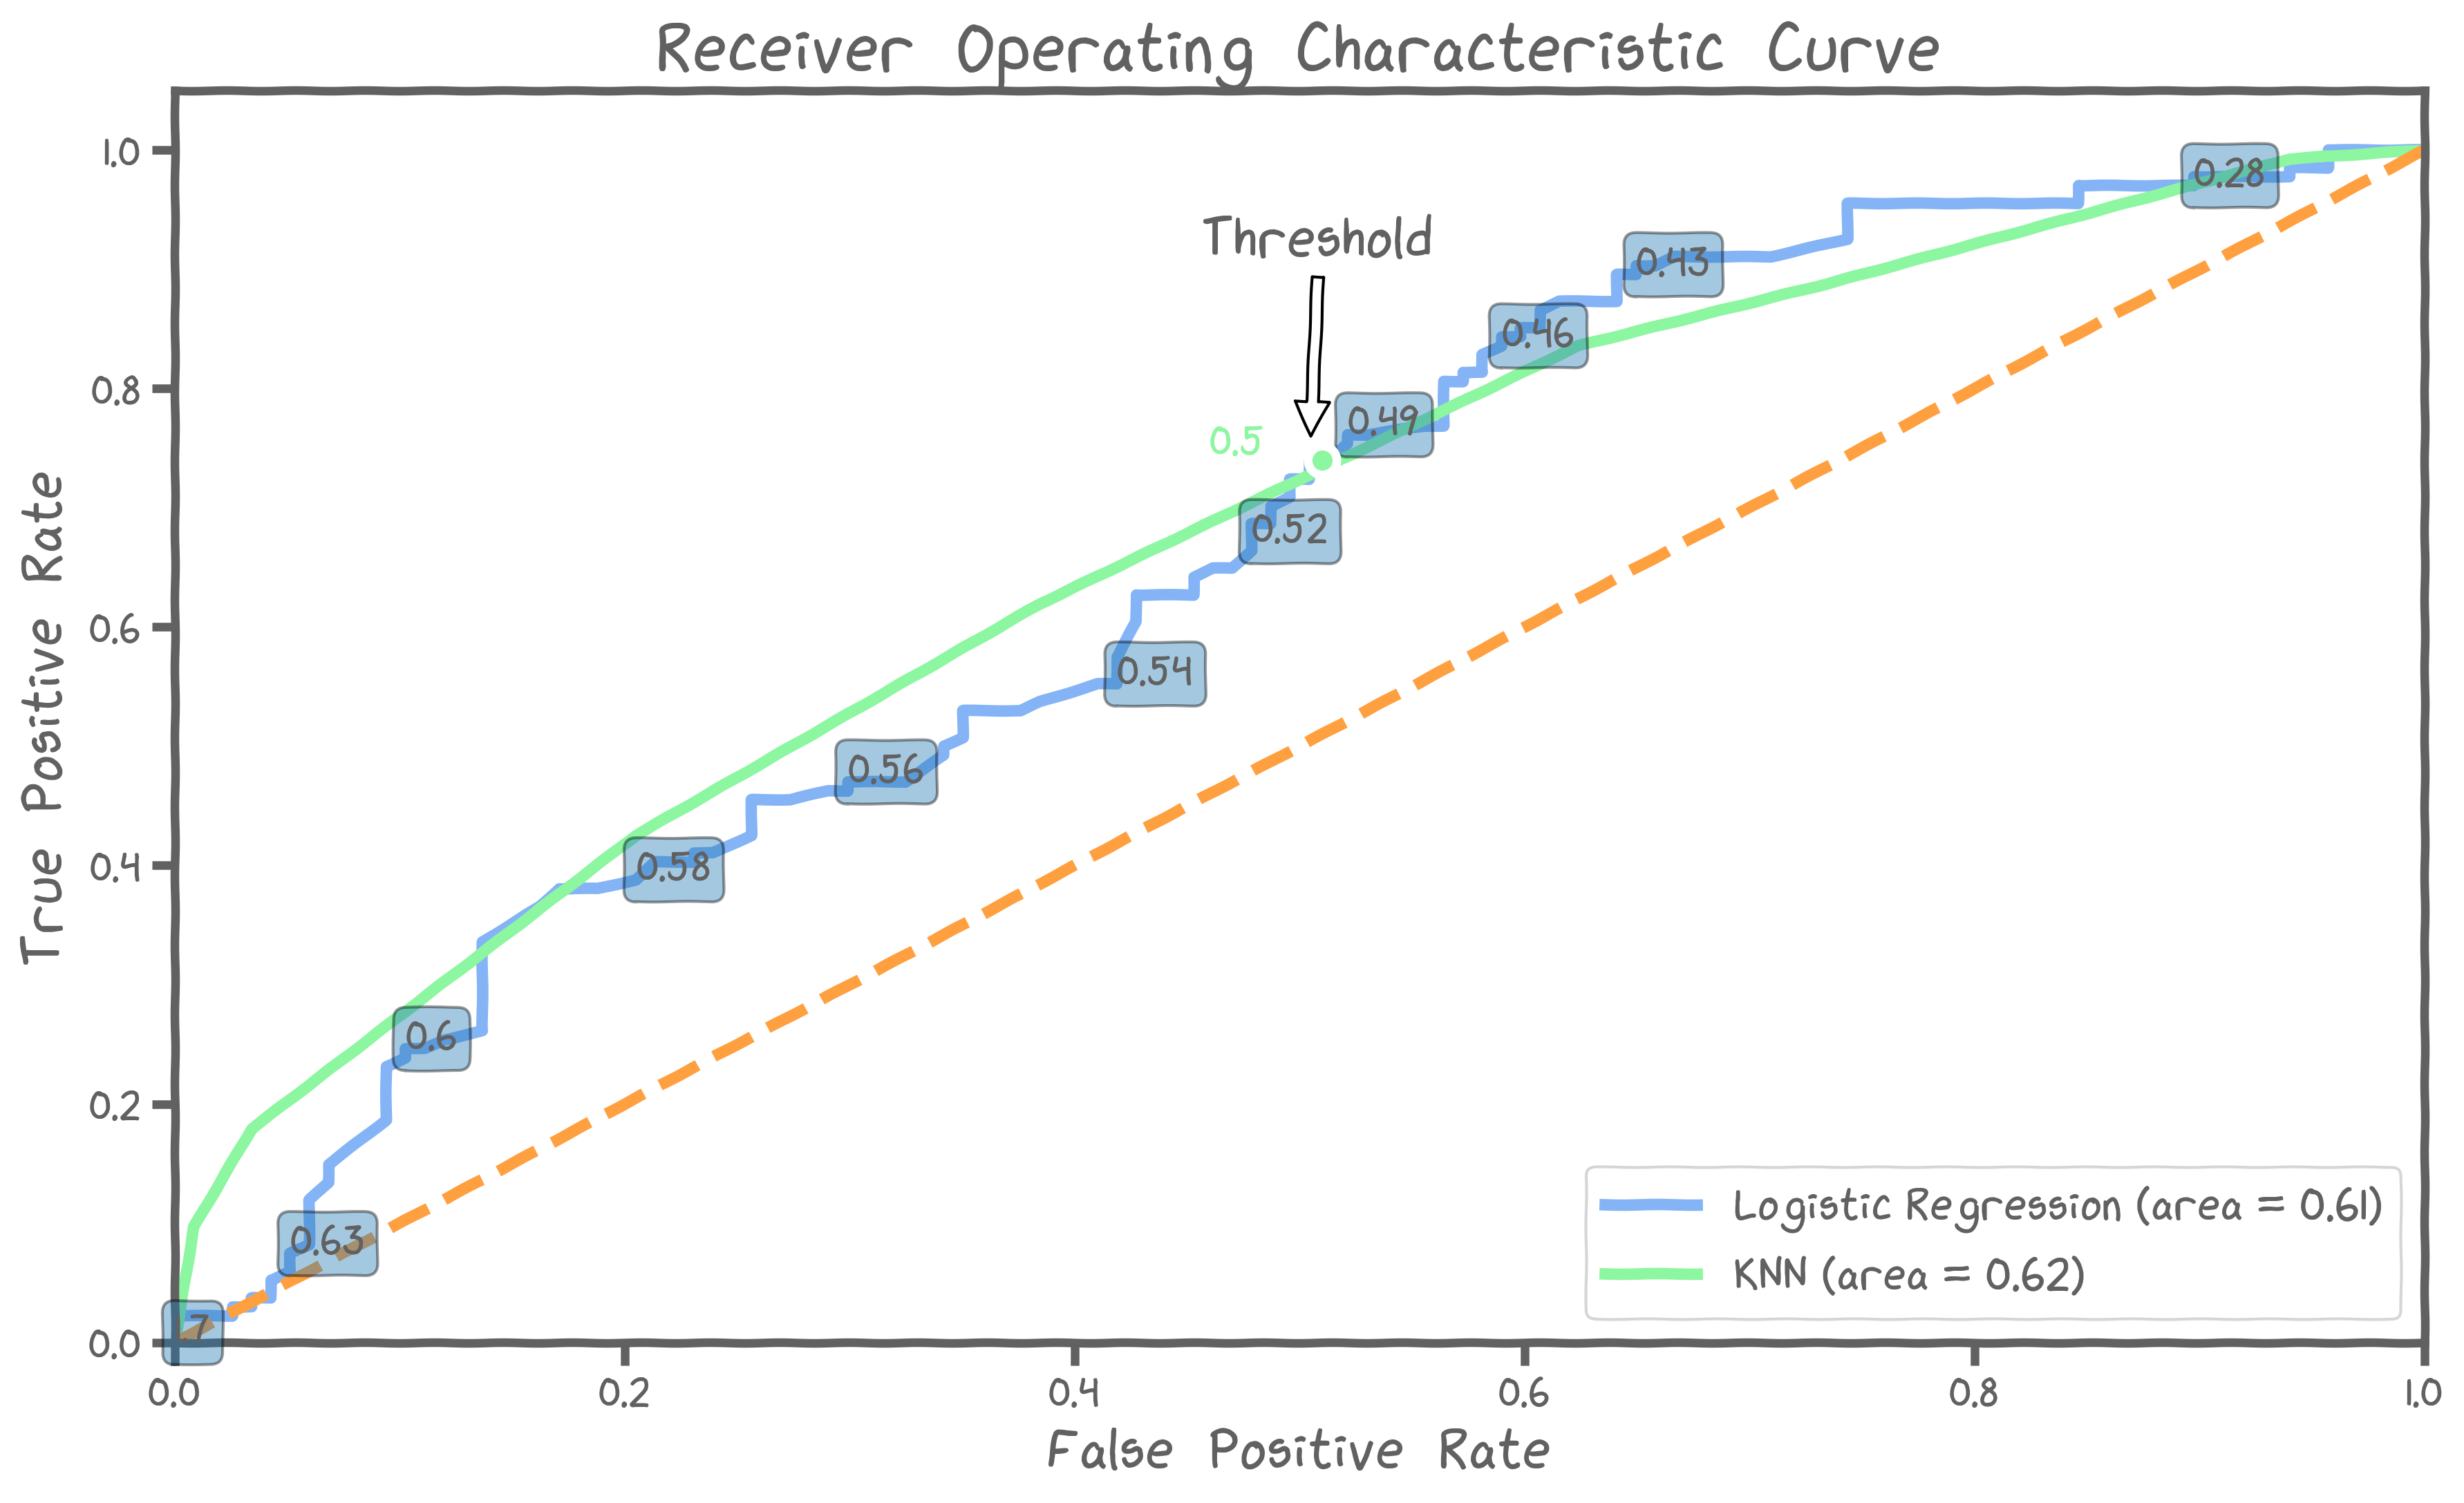
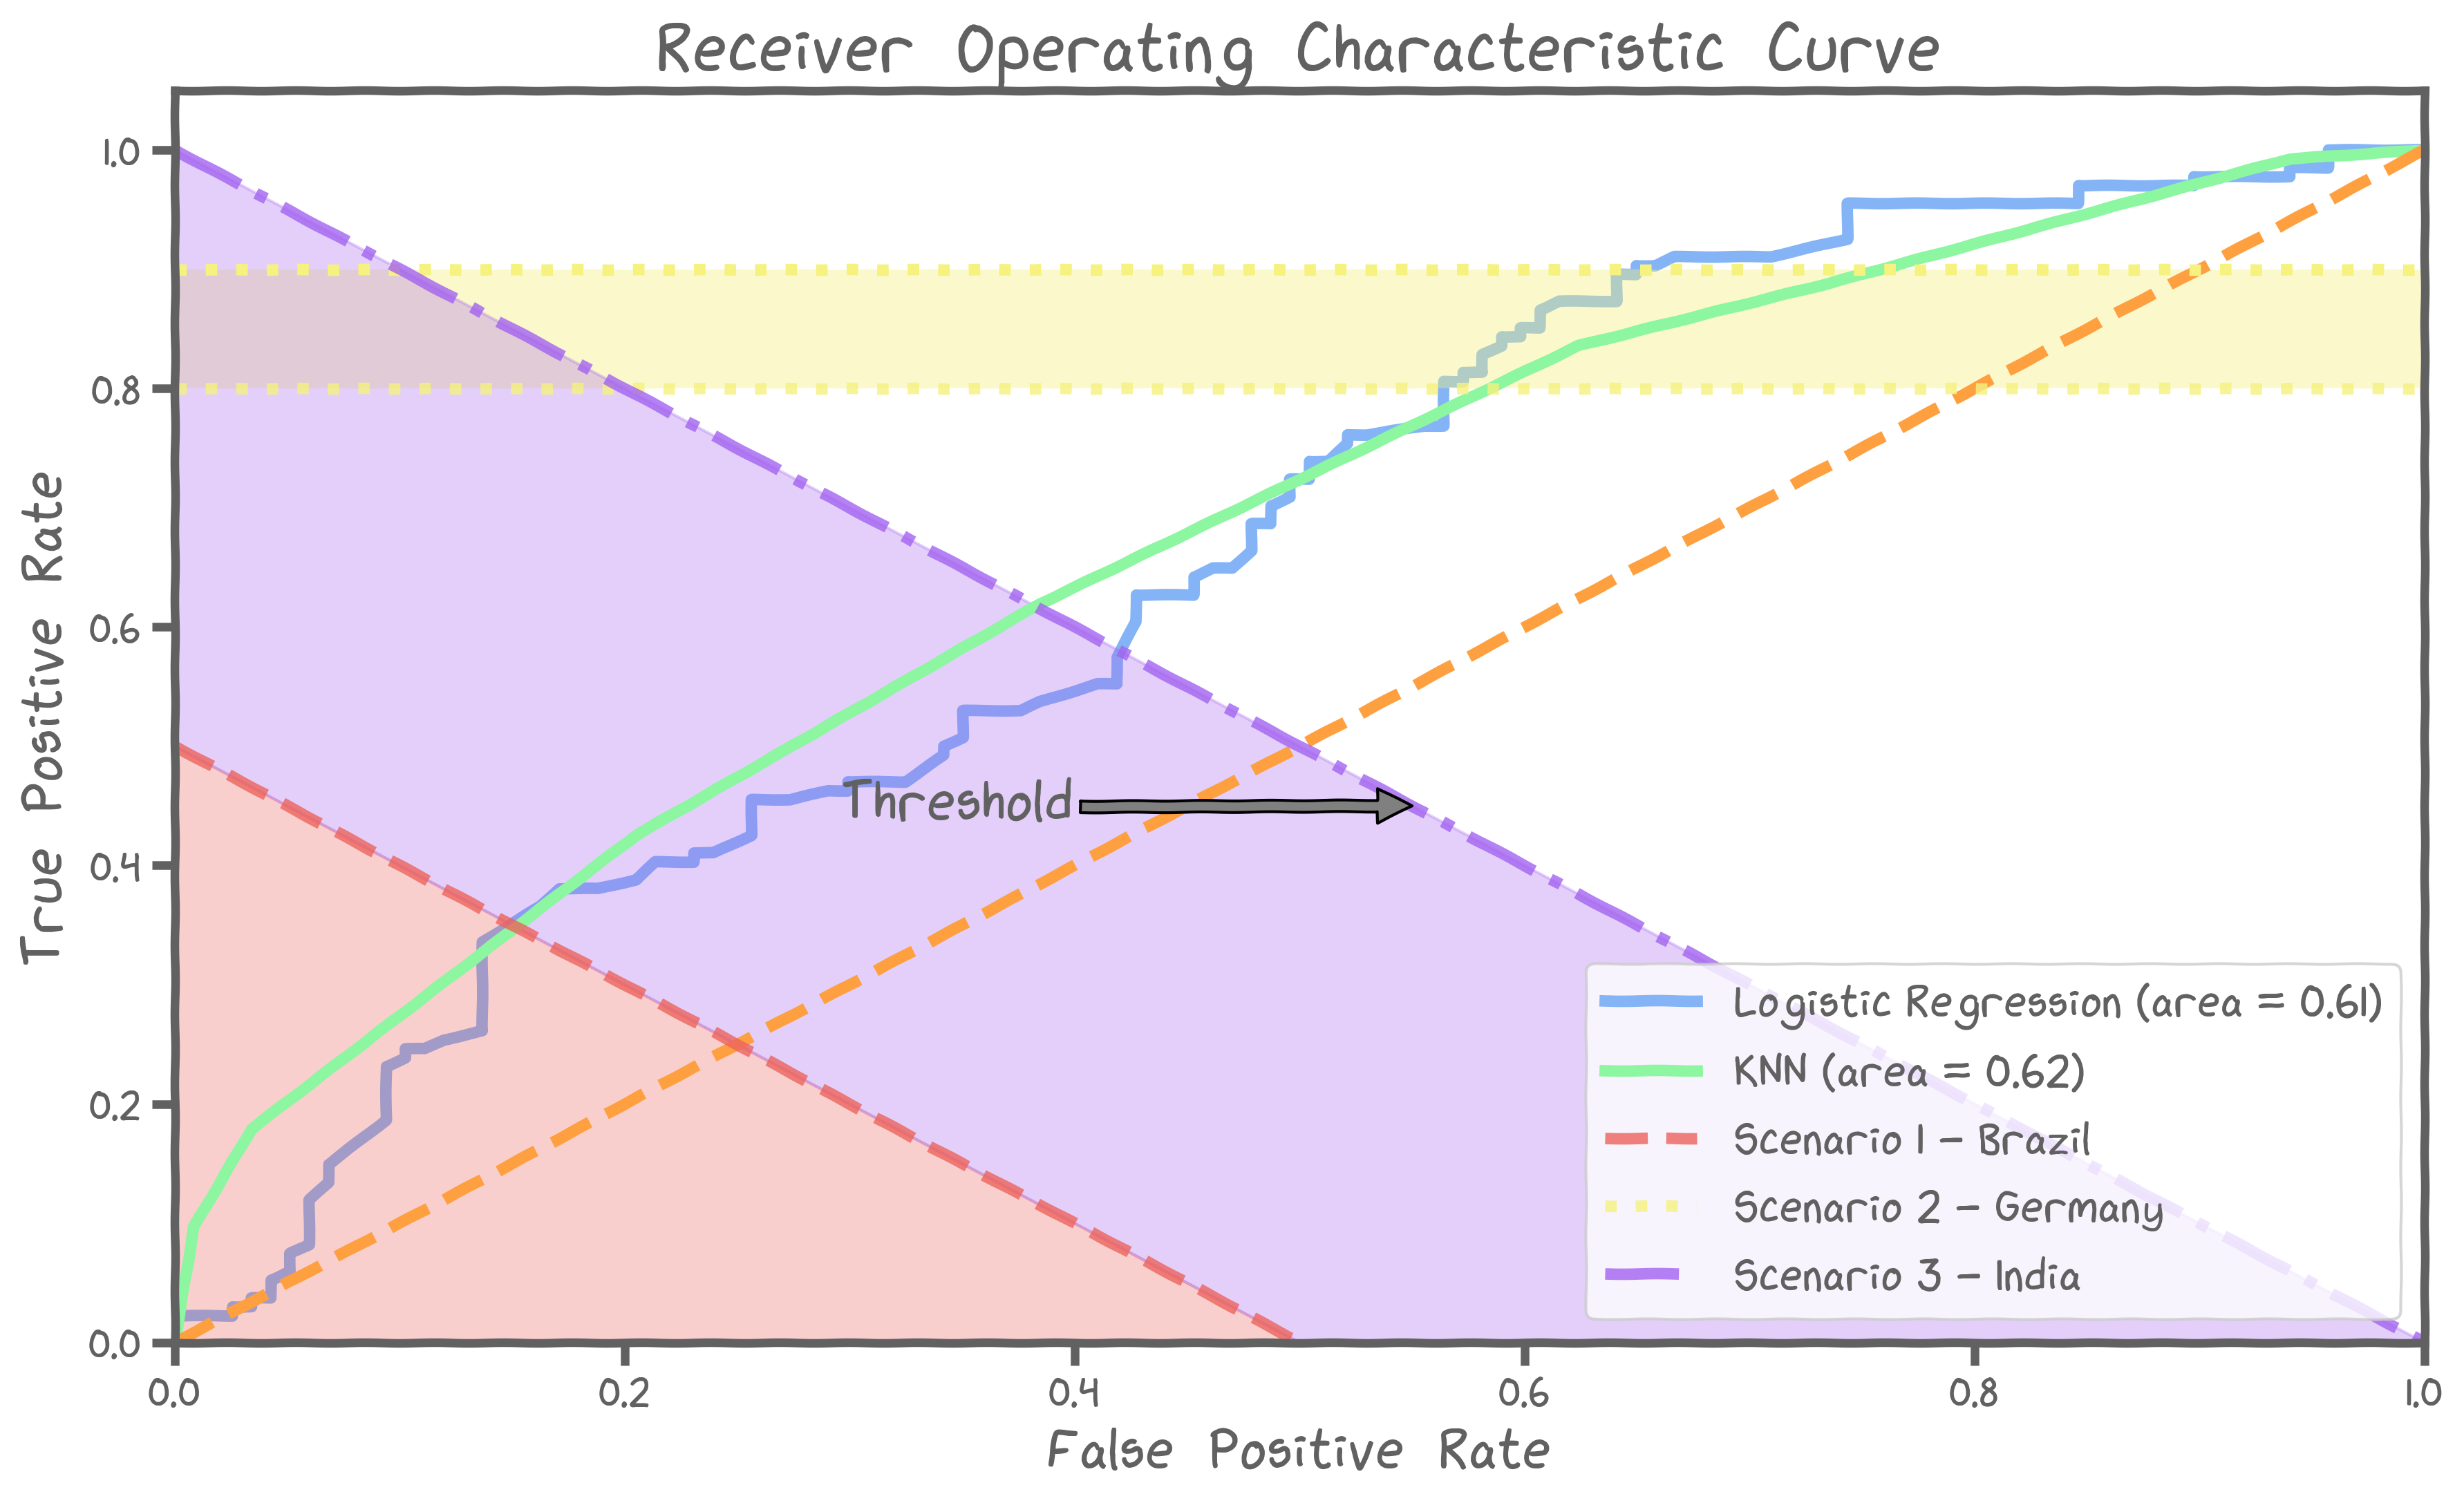
The Receiver Operating Characteristics Curve
We can visualize how things change as we vary the threshold with the Receiver Operating Characteristics curve (ROC). You saw this earlier in the course, in Max's video!
ROC curves are a very powerful tool as a statistical performance measure in detection/classification theory. The ROC curve is created by plotting the true positive rate (TPR) against the false positive rate (FPR) at various threshold settings. They were first developed by radar engineers during World War II for detecting enemy objects on battlefields.

As the image indicates, a perfect classifier has an ROC curve that goes straight up and then across to the right at a true positive rate of 100%. A completely random classifier has a curve that is a diagonal line from the bottom left (0%, 0%) to the top right (100%, 100%).
4. Utility-What matters most?
Even with the ROC curve as a tool, we cannot really tell which model to use. As you can see in the graph below, the two models are very similar. At a false positive rate of 0.5 they even have the exact same value for true positives.
Hence, we need to ask an important question: what do we care about the most?
Reminder
These are examples, not the actual way that each country handled the pandemic. While the strategies we describe below are simplified versions of each country's approach, we do not know how they actually decided on their COVID-19 responses.
Scenario 1 - Brazil
In Brazil, the new COVID variant is contagious and infects many citizens. Brazilian officials, however, dictate that hospitals do not classify many people at 'high' risk to avoid bad press and subsequent political global backlash. To model this scenario well, we need the best classifier with the following restriction:
Scenario 2 - Germany
German officials want the fatality ratio to be as low as possible. Thus, it is imperative to find cases that need urgent attention and give them the best chance of survival. Therefore, we need the best classifier with the following restriction:
Scenario 3 - India
India has only 1 million beds left and there are already 2 million people suspected of having the disease. Officials need to work out a strategy to find the people who are in the most need of urgent care. This scenario leads to the following restriction:
This is a case for a balanced dataset
5. Best model for each case
Given that we have produced an ROC plot similar to the one shown here, we would want to find the best model for each of the three cases.

5.1 Choice of Classifier
Based on the constraints, we have the following choice of classifier:
BRAZIL : Logistic regression with a high threshold
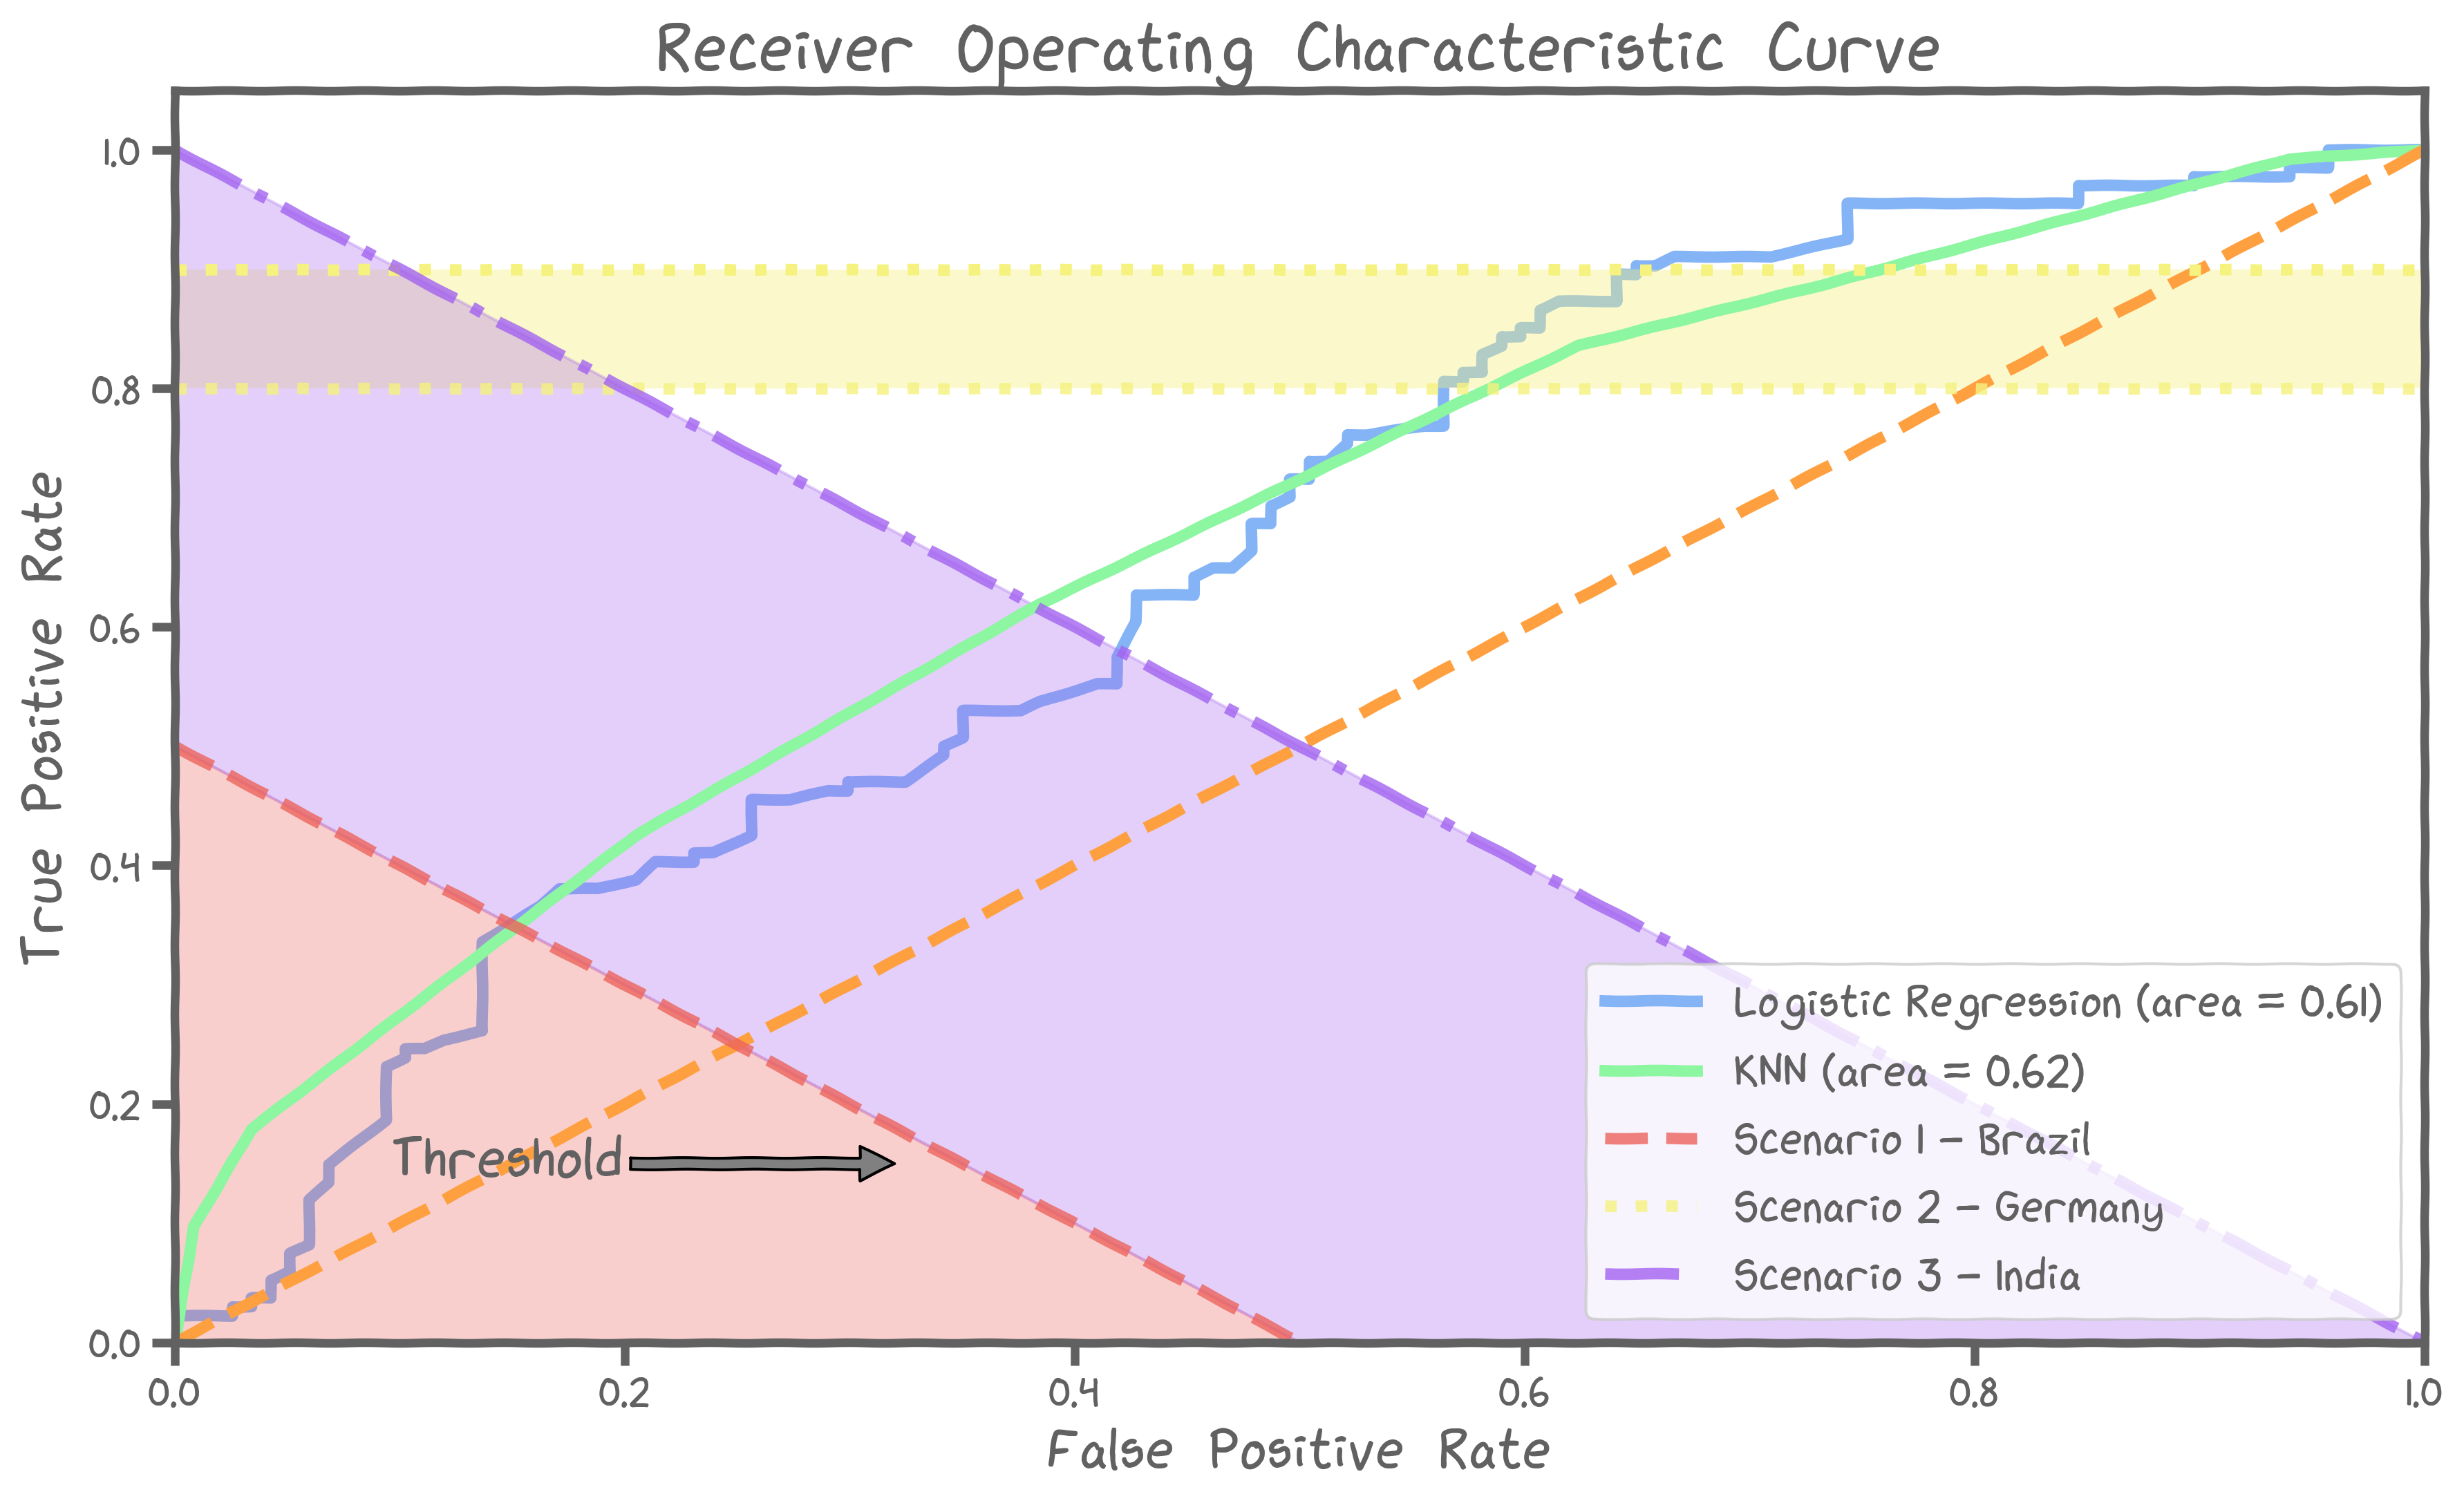
GERMANY : Logistic regression with a low threshold
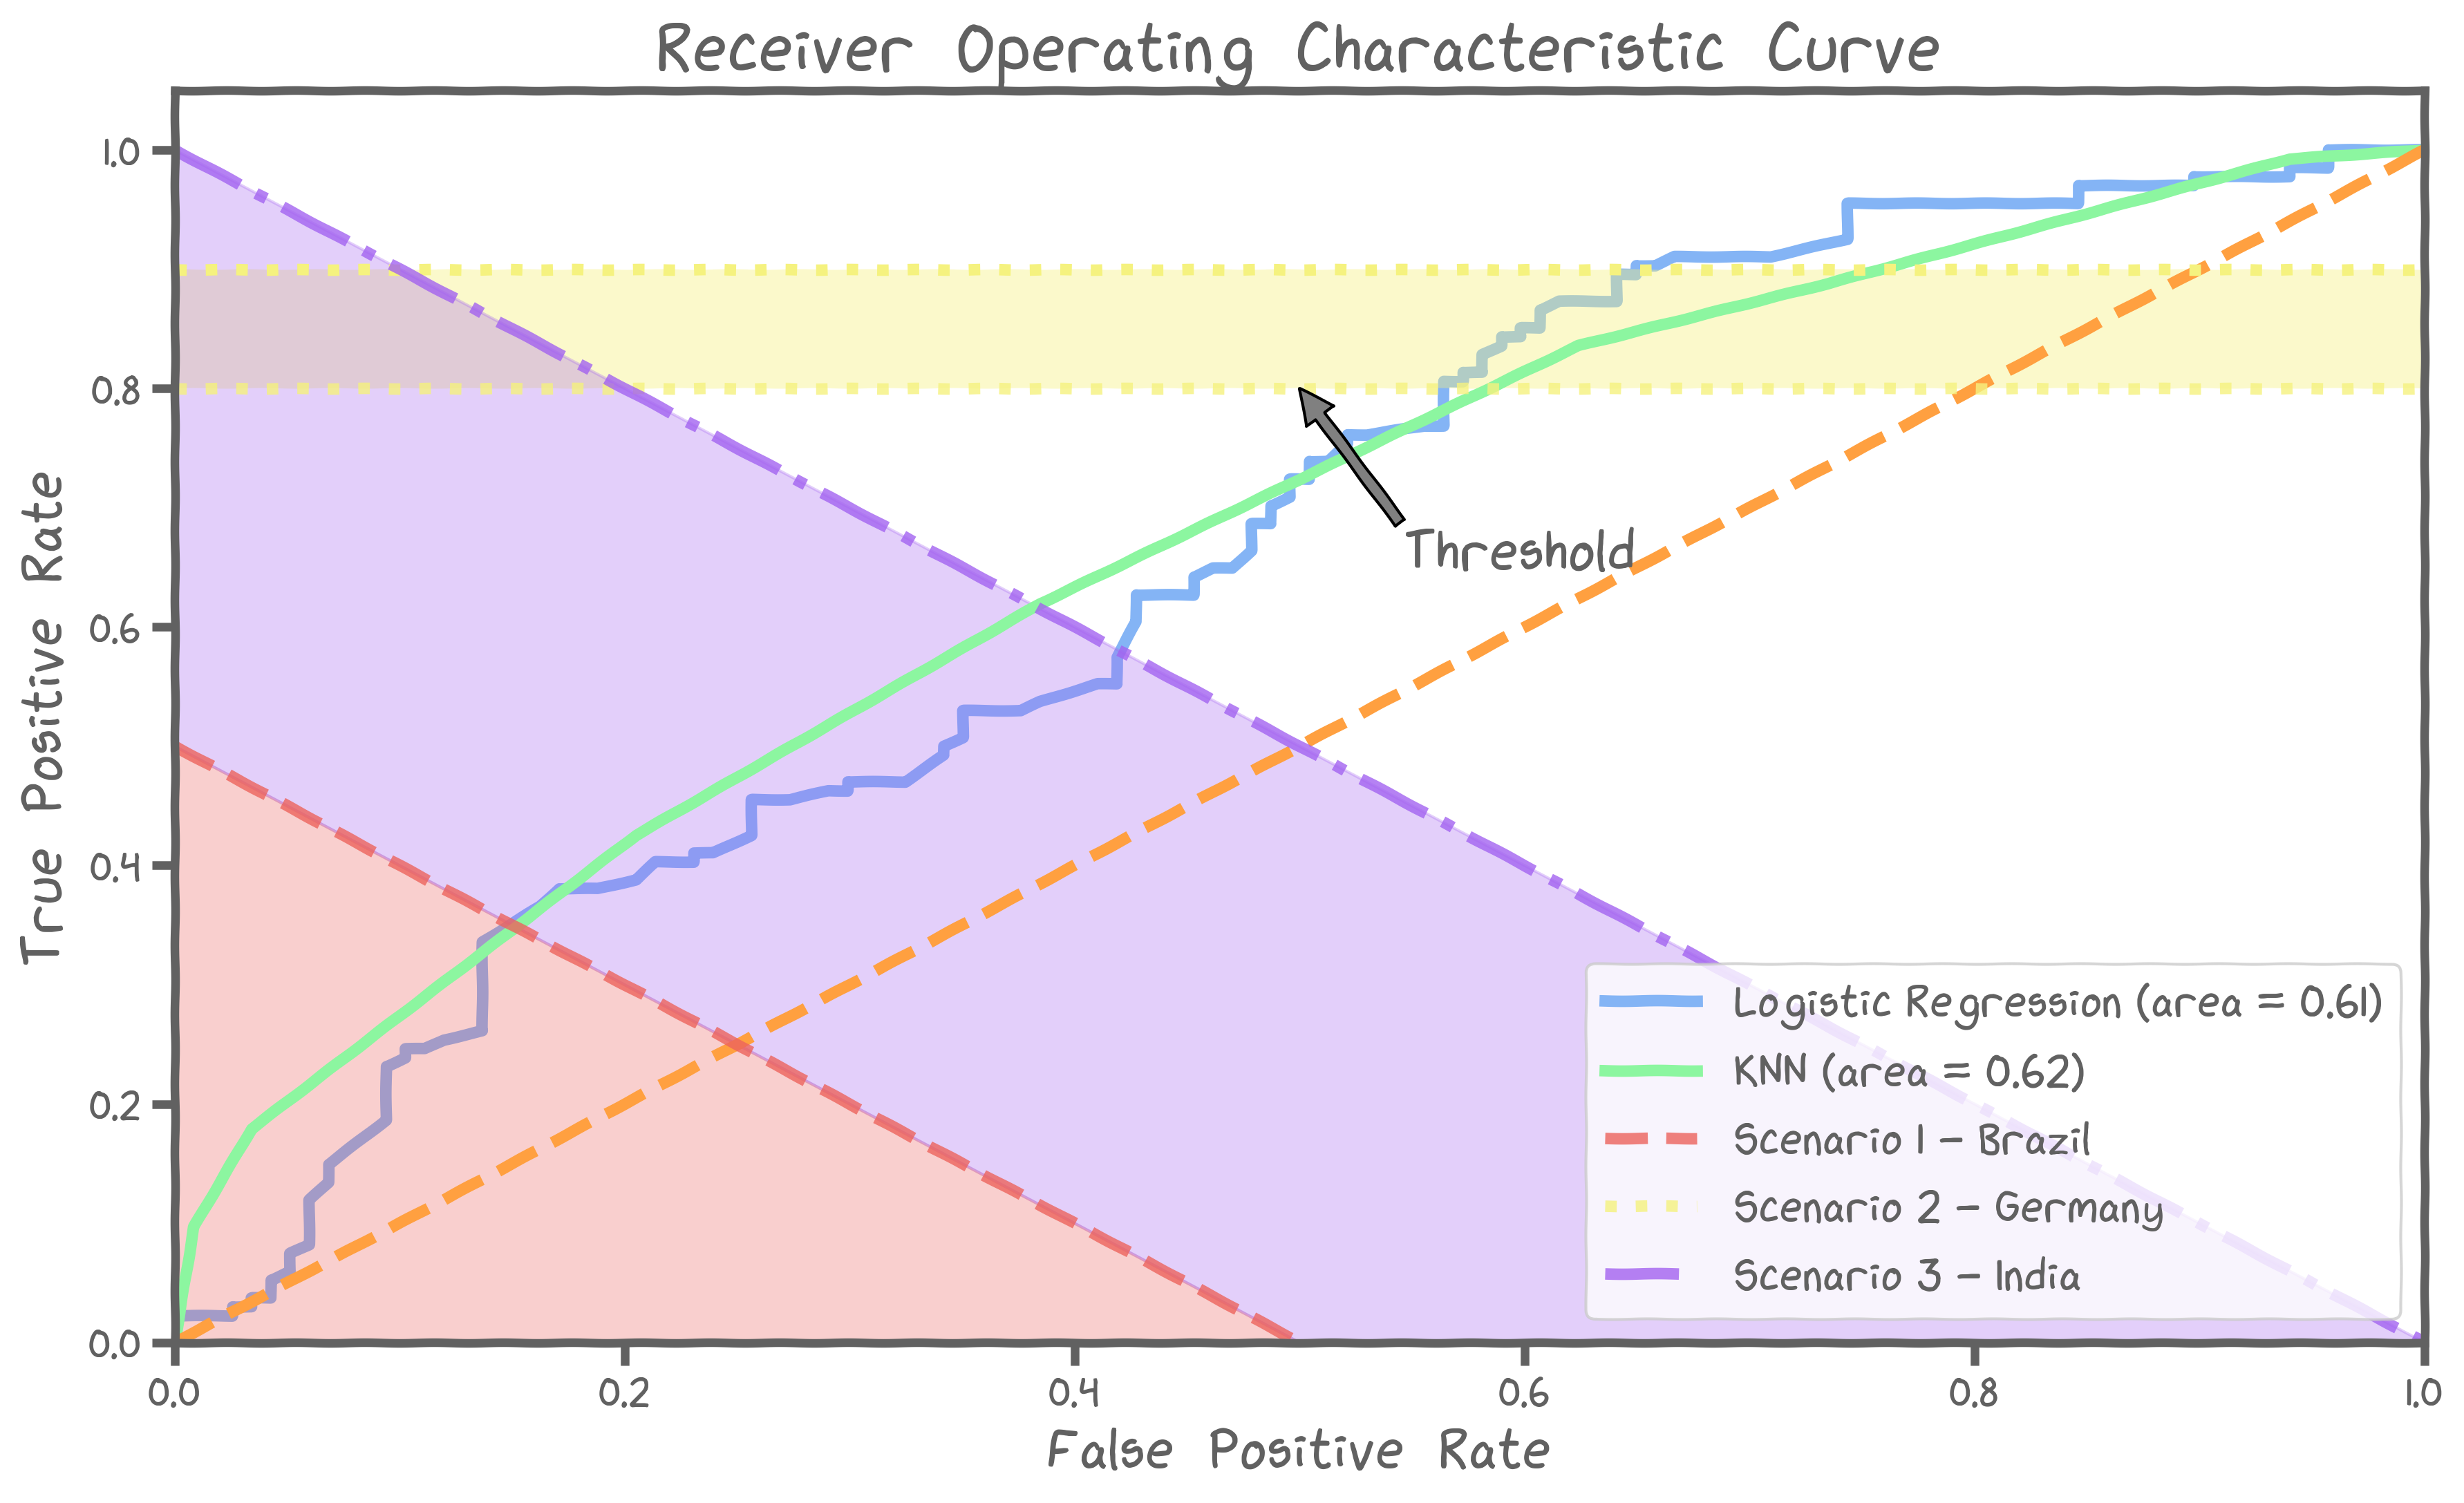
INDIA : kNN classifier with a moderate threshold


 1556
1556


 被折叠的 条评论
为什么被折叠?
被折叠的 条评论
为什么被折叠?
 到【灌水乐园】发言


