


Dictionary Learning (2011)
阅读 Dictionary Learning (2011). What is the right representation for my signal?(I Tošić, P Frossard)
Huge amounts of high-dimensional information are captured every second by diverse natural sensors such as the eyes or ears, as well as artificial sensors like cameras or microphones. This information is largely redundant in two main aspects: it
often contains multiple correlated versions of the same physical world and each version is usually densely sampled by generic sensors. The relevant information about the underlying processes that cause our observations is generally of much reduced dimensionality compared to such recorded data sets. The extraction of this relevant information by identifying the generating causes within classes of signals is the central topic of this article. We present methods for determining the proper representation of data sets by means of reduced dimensionality subspaces, which are adaptive to both the characteristics of the signals and the processing task at hand.
-
这里就已经提出了,字典学习是基于这样一个准则
- 从一个 降维的字典 中提取出来 sparse atom 是字典学习的主要范式,也就是说,现实中的所有观察都是可以从一个 稀疏 的,离散的字典中提取出来。
These representations are based on the principle that our observations can be described by a sparse subset of atoms taken from a redundant dictionary, which represents the causes of our observations of the world. We describe methods for learning dictionaries that are appropriate for the representation of given classes of signals and multisensor data. We further show that dimensionality reduction based on dictionary representation can be extended to address specific tasks such as data analysis or classification when the learning includes a class separability criteria in the objective function. The benefits of dictionary learning clearly show that a proper understanding of causes underlying the sensed world is key to task-specific representation of relevant information in high-dimensional data sets.
WHAT IS THE GOAL OF DIMENSIONALITY REDUCTION?
Natural and artificial sensors are the only tools we have for sensing the world and gathering information about physical processes and their causes. These sensors are usually not aware of the physical process underlying the phenomena they “see,” hence they often sample the information with a higher rate than the effective dimension of the process. However, to store, transmit or analyze the processes we observe, we do not need such abundant data: we only need the information that is relevant to understand the causes, to reproduce the physical processes, or to make decisions. In other words, we can reduce the dimension of the sampled data to the effective dimension of the underlying process without sensible penalty in the subsequent data analysis procedure.
实际上,这里点明了两个哲学观点,第一个,传感器或者器官感知外部通常产生更多的冗余维度信息。第二,那么不冗余的信息只有原因。就是我对于一个信息的可以这样压缩,就是只记录原因,发生的起点,然后将信息压缩到真实信息本该有的维度。
这里解释一下:
1. 人看到感觉到的东西其实都非真实的,都是模拟出来的,电视电脑听觉,这些感觉的采样过程都是高于真实频率的。
2. 通过原始数据的原因起点就能模拟之后发生的所有过程,那么之后发生的所有过程就不需要进行记录,是冗余的信息。对于人类说,就是预测,一叶知秋。
降维是一种减少随机变量集合数量的技术,通常用于数据预处理和数据可视化领域。它的主要目标包括,减少计算复杂性:通过减少数据集的维度,可以显著降低模型训练的计算成本,使得数据处理和模型训练变得更加高效。缓解维度灾难:在高维数据中,由于维度的指数增长,数据点之间的距离变得非常稀疏,这会导致机器学习模型性能下降,即所谓的“维度灾难”。通过降维,可以减轻这一问题。提高模型性能:降维有助于去除数据中的噪声和冗余特征,保留最重要的特征,这可能会提高模型的预测性能。数据可视化:将数据降至2维或3维,使得高维数据能够在平面或立体空间中可视化,帮助人们直观理解数据结构和特征间的关系。降维技术常见的方法包括主成分分析(PCA)、线性判别分析(LDA)、t-分布随机邻域嵌入(t-SNE)和自编码器等。通过降维,我们不仅能提升数据处理的效率和模型的性能,还能更好地理解和解释数据。
但同时,很多问题提升维度就能解决的很好,深度学习的基本思想之一就是将信息提升维度,在高维上解决看似传统方法难以解决的问题。到底怎么处理维度实际上是一门学门,多少是多了,减少又减少多少都是很有意思的问题。
我有一个观点就是
解决问题需要提高维度,分析问题需要降低维度
An intuitive way to approach this dimensionality reduction problem is first to look at what generates the dimensionality gap between the physical processes and the observations.
那么是什么造成了真实与模拟之间维度的差异
The most common reason for this gap is the difference between the representation of data defined by the sensor and the representation in the physical space.
作者认为是模拟器中定义的表达和真实世界中的表达不同
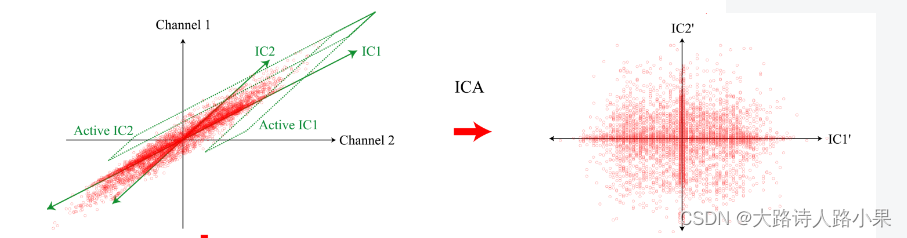
In some cases, this discrepancy is, for example, a simple linear transform of the representation space, which can be determined by the well-known principal component analysis (PCA) [1] method. It may however happen that the sensors observe simultaneously two or more processes with causes lying within different subspaces. Other methods such as independent component analysis (ICA) [2] are required to understand the different processes behind the observed data. ICA is able to separate the different causes or sources by analyzing the statistical characteristics of the data set and minimizing the mutual information between the observed samples.
PCA (u1的降维比u2好,但是也很局限)

主成分分析(PCA)和独立成分分析(ICA)是两种常用的数据降维和特征提取技术,它们在许多领域,如信号处理、图像处理和金融分析中都有广泛的应用。尽管PCA和ICA在某些方面相似,但它们在目标、方法和应用方面有着本质的区别。
PCA(主成分分析)目标:PCA的目标是找到数据中方差最大的方向,并将数据投影到这些方向上,以此来减少数据的维度。这些方向被称为主成分,它们是数据协方差矩阵的特征向量。方法:PCA通过对数据的协方差矩阵进行特征分解来实现,寻找能够最大化数据方差的正交成分。
假设:PCA假设数据的主要信息包含在方差最大的几个维度中。
应用:PCA通常用于降维、数据压缩、特征抽取等场景,特别是在数据预处理和探索性数据分析中非常有用。
为了克服PCA的一些缺点,出现了很多PCA的变种,比如为解决非线性降维的KPCA,还有解决内存限制的增量PCA方法Incremental PCA,以及解决稀疏数据降维的PCA方法Sparse PCA等。
ICA(独立成分分析)
目标:ICA的目标是找到一个线性变换,使得通过这个变换后的成分相互独立。ICA试图发现隐藏在多维数据背后的独立信号源。
方法:ICA通过最大化输出信号统计独立性的非高斯性来实现,这通常涉及到优化计算。
假设:ICA假设数据是由若干独立信号源线性混合形成的,并且这些源信号的统计分布是非高斯的。
应用:ICA被广泛应用于盲信号分离问题,如从多个传感器记录中分离出原始信号,常见于医学成像分析(如功能性磁共振成像fMRI)、语音信号处理等领域。
主要区别
目标和假设:PCA旨在发现能够最大化数据方差的方向,而ICA旨在将数据分解为统计独立的成分。PCA关注数据的方差,而ICA关注成分的独立性。
统计性质:PCA利用数据的二阶统计特性(协方差),而ICA利用高阶统计特性来实现信号源的分离。
应用场景:由于它们背后的假设不同,PCA和ICA适用于不同类型的问题。PCA更适用于数据压缩和降维,ICA更适用于信号源的分离和识别。
综上所述,尽管PCA和ICA都可以用于降维,但它们适用于不同的问题和场景,基于的假设和方法也有所不同。在选择使用哪种技术时,需要根据数据的特性和分析的目标来决定。
However, ICA techniques respect some orthogonality conditions such that the maximal number of causes is often limited to the
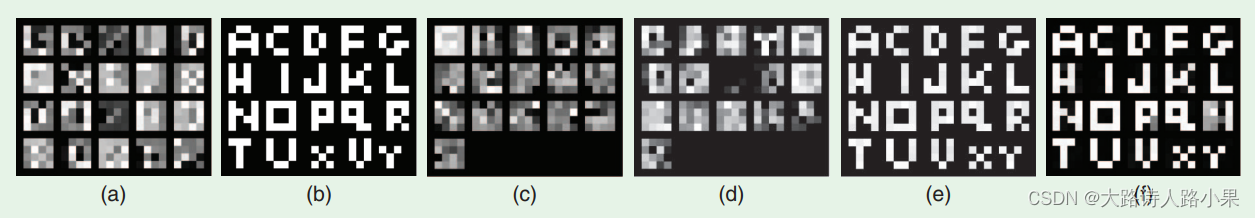
signal dimension. In Figure 1(a), we show some examples of noisy images whose underlying causes are linear combinations of two English letters chosen from a dictionary in Figure 1(b). These images are 4 3 4 pixels, hence their dimensionality in the pixel space is 16, while the number of causes is 20 (total number of letters). When applied to 5,000 randomly chosen noisy samples of these letters, PCA finds a linear transform of the pixels space into another 16-dimensional space represented by vectors in Figure 1©. This is done by finding the directions in the original space with the largest variance. However, this representation does not identify the processes that generate the data, i.e., it does not find our 20 letters. ICA [2] differs from PCA because it is able to separate sources not only with respect to the second order correlations in a data set, but also with respect to higher order statistics. However, since the maximal number of causes is equivalent to the signal dimension in the standard ICA, the subspace vectors found by ICA in the example of Figure 1(d) do not explain the underlying letters.
The obvious question is: Why should we constrain our sensors to observe only a limited number of processes? Why do we
need to respect orthogonality constraints in the data representation subspace? There is no reason to believe that the number
of all observable processes in nature is smaller than the maximal dimension in existing sensors. If we look for an example in
a 128 3 128 dimensional space of face images for all the people in the world, we can imagine that all the images of a single person belong to the same subspace within our 16,384-dimensional space, but we cannot reasonably accept that the total number of people in the world is smaller than our space dimension. We conclude that the representation of data could be overcomplete, i.e., that the number of causes or the number of subspaces used for data description can be greater than the signal dimension.
Where does the dimensionality reduction occur in this case? The answer to this question lies in one of the most important principles in sensory coding—efficiency, as first outlined by Barlow [3]. Although the number of possible processes in the world is huge, the number of causes that our sensors observe at a single moment is much smaller: the observed processes are sparse in the set of all possible causes. In other words, although the number of representation subspaces is large, only few ones will contain data samples from sensor measurements. By identifying these few subspaces, we find the representation in the reduced space.
总结:
传感器冗余:首先,文中提到的传感器冗余指的是传感器捕获的信息量远远超出了我们实际需要理解底层过程所需的信息。这种冗余来自于对相同场景的重复、多角度的观测,以及对每个场景的密集采样。这意味着,很多时候,我们捕获的数据中包含了大量重复或相关的信息。
信息的实际维度:尽管传感器捕获了大量数据,但是,这些数据中包含的真正有用的信息——即那些能帮助我们理解观察到的现象的根本原因的信息——其实在维度上是比较低的。换句话说,尽管我们有很多数据,但描述现象背后的基本过程或模式所需的信息并不复杂。
为什么需要过完备表示:过完备表示的提议并不是要增加观察到的现象的复杂性,而是为了更灵活、更全面地捕获和表述这些现象背后的原因。过完备表示允许我们使用的“字典”或“基元集合”(用于数据表示的基础元素)比原始数据的实际维度要多。这样做的优点在于它提供了更多的灵活性来捕捉和表示那些以传统方法可能难以捕捉的模式或关系。即使这种表示方法在技术上是“过多”的,但它可以让我们更好地逼近、理解和分析数据中的复杂结构和多样性。
总结来说,尽管传感器捕获的数据在维度上是冗余的,但这并不意味着我们就应该仅限于用低维的方式去表示和理解这些数据。过完备表示提供了一种通过增加表示的“维度”来更全面地捕捉和理解数据背后复杂现象的方法。这是一种从不同角度、使用更丰富的“词汇”来描述和理解世界的尝试。


 4252
4252


 被折叠的 条评论
为什么被折叠?
被折叠的 条评论
为什么被折叠?
 到【灌水乐园】发言


