


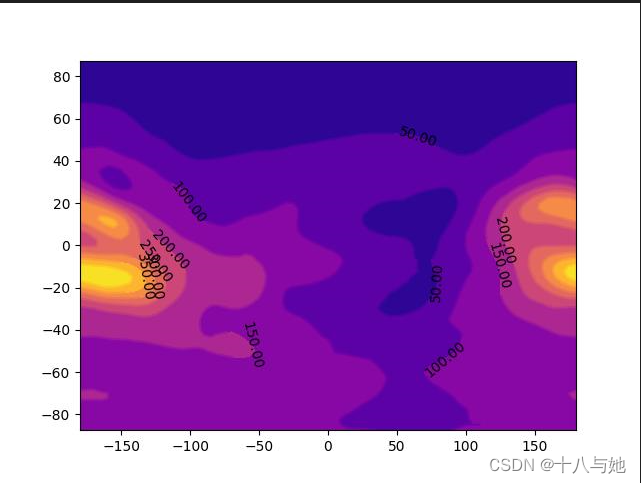
在进行某些研究时,需要对电离层的日变化进行分析,以便直观清晰地看到电离层的变化,博主利用CDDIS的电离层格网数据,基于Python编写了电离层地图绘制函数
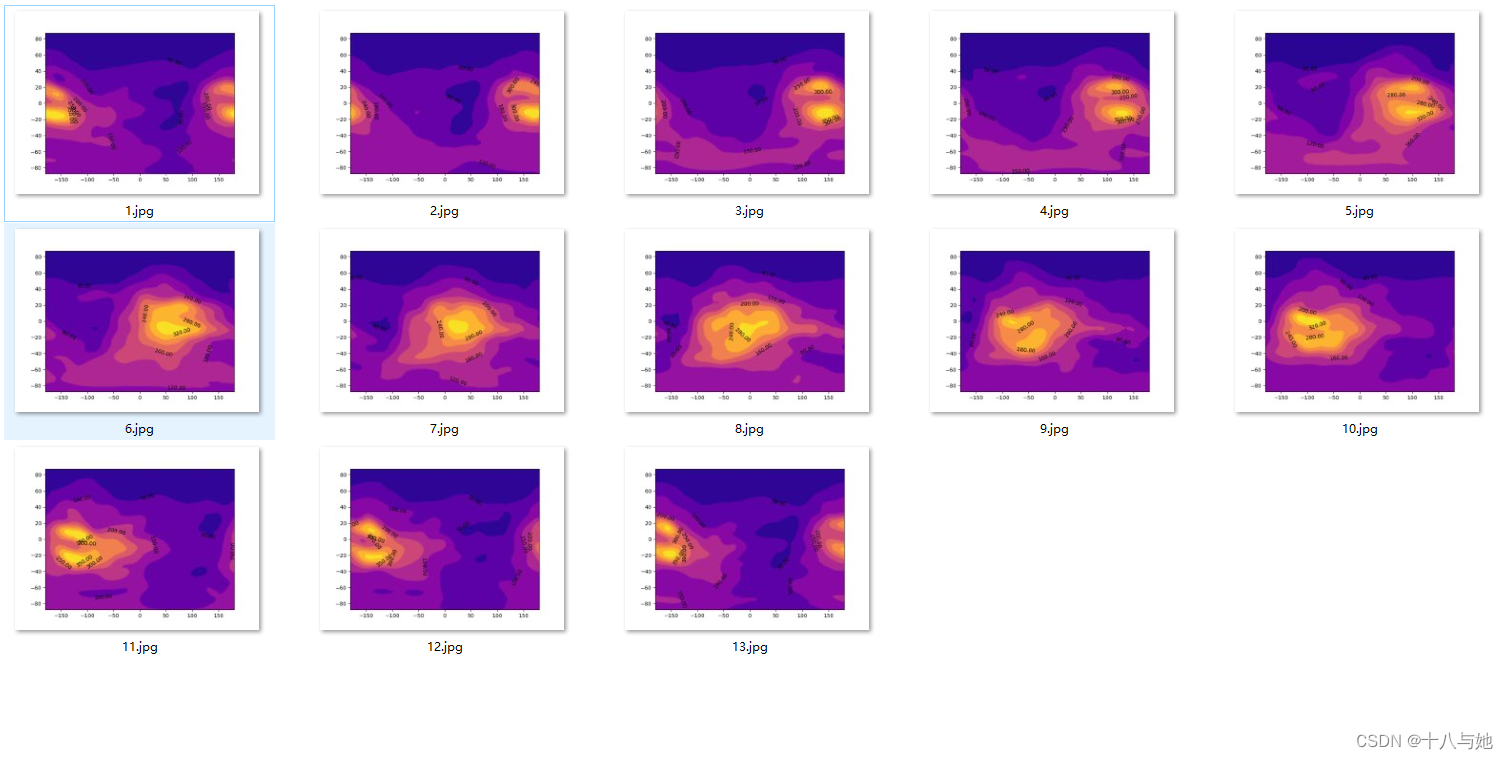
一天TEC效果图
以下是一天之内的电离层变化地图及源码


一天TEC源码
# -*- coding: utf-8 -*-
# @Time    : 2022/1/3 14:21
# @Author  : xymeng
# @FileName: 001.py 绘制TEC等值线专用程序
# @Software: PyCharm

import os
import numpy as np
import matplotlib.pyplot as plt


'''
store the lat,lon,and,TEC value
'''
lat = []
lon = []
TEC0 = []
TEC = []
TEC2D = np.zeros(shape=(71,73))
picnum = 1
timenum = 1
folder = r'F:\i-File\2021'

'''
Search for each ionex file
'''

for ifile in os.listdir(folder):
    '''
    num: Record the count of the region
    count: Record the count of the Map
    '''
    num = 1
    count = 1
    timenum = 0
    path = os.path.join(folder,ifile)
    print(path)
    with open(path) as ionex:
        icontent0 = ionex.readlines()
        for i in range(len(icontent0)):
            '''
            Turn list including other symbol into list only consisting of character
            '''
            icontent1 = icontent0[i].split(' ')
            for x in range(icontent1.count('')):
                icontent1.remove('')
            if len(icontent1) >= 5:
                if icontent1[-1] == 'LAT/LON1/LON2/DLON/H\n' and num <= 71 and count <= 13:
                    Lon0 = -180.0
                    Lat0 = 90
                    deltla = 2.5
                    deltlo = 5
                    Lat0 = Lat0 - (deltla * num)
                    lat.append(Lat0)

                    num = num + 1
                    '''
                    Begin putting TEC value into TSC list
                    '''
                    ynum = 0

                    for y in range(1,6):
                        tecvalue1 = icontent0[i+y].split(' ')
                        for z in range(tecvalue1.count('')):
                            tecvalue1.remove('')
                        for lo in range(len(tecvalue1)):
                            if num == 2:
                                lon.append(Lon0)
                            TEC2D[num-2][ynum] = int(tecvalue1[lo])
                            ynum = ynum + 1
                            Lon0 = Lon0 + deltlo
                    if num >= 72:
                        timenum = timenum + 1
                        LON,LAT = np.meshgrid(lon,lat)
                        plt.figure()
                        plt.contourf(LON, LAT, TEC2D, 8, cmap='plasma')
                        C = plt.contour(LON, LAT, TEC2D,  8, cmap='plasma')
                        # 添加标记,标记处不显示轮廓线,颜色为黑色,保留两位小数
                        plt.clabel(C, inline=True, colors='k', fmt='%1.2f')
                        path = 'F:/contour-outcome'+'/'+str(picnum)+'/'
                        if not os.path.exists(path):  # 如果不存在路径,则创建这个路径
                            os.makedirs(path)
                        print(path)
                        plt.savefig(path+'/'+str(timenum)+'.jpg')
                        plt.close()
                        num = 1
                        count = count + 1
                        lon.clear()
                        lat.clear()
                        TEC = list(TEC)
                        TEC.clear()
                        TEC2D = np.zeros(shape=(71,73))


    picnum = picnum + 1
    lon.clear()
    lat.clear()
    TEC.clear()
    TEC2D = np.zeros(shape=(71,73))
绘制指定区域电离层地图效果图
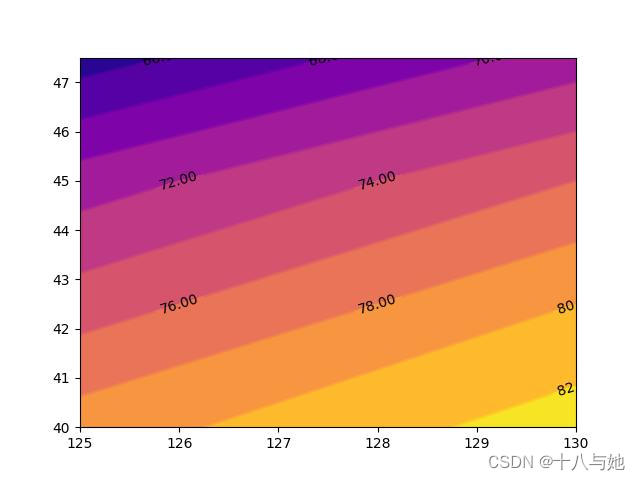
绘制指定区域的源码
# -*- coding: utf-8 -*-
# @Time    : 2022/1/20 10:48
# @Author  : xymeng
# @FileName: 001-specify.py 用于获取指定区域TEC图的程序
# @Software: PyCharm

import os
import numpy as np
import matplotlib.pyplot as plt
'''
绘图区域在指定经纬度5°的范围
'''
span = 5
Lat = input('请输入纬度:'.format())
Lon = input('请输入经度:'.format())
Latdown = int(Lat) - span
Londown = int(Lon) - span
Latup = int(Lat) + span
Lonup = int(Lon) + span
counLat = int(2 * (span/2.5))
counLon = int(2 * (span/5))
numlat = int((90-int(Lat))/2.5) + 2
print(counLat)
print(counLon)
print(numlat)
'''
store the lat,lon,and,TEC value
'''
lat = []
lon = []
TEC0 = []
TEC = []
TEC2D = np.zeros(shape=(counLat,counLon))
picnum = 1
timenum = 1
num1 = 0
folder = r'F:\i-File\2021'
'''
定义初始经纬度
'''
Lon0 = -180.0
Lat0 = 90
'''
Search for each ionex file
'''

for ifile in os.listdir(folder):
    '''
    num: Record the count of the region
    count: Record the count of the Map
    '''
    num = 1
    count = 1
    timenum = 0
    path = os.path.join(folder,ifile)
    print(path)
    with open(path) as ionex:
        icontent0 = ionex.readlines()
        for i in range(len(icontent0)):

            '''
            Turn list including other symbol into list only consisting of character
            '''
            icontent1 = icontent0[i].split(' ')
            for x in range(icontent1.count('')):
                icontent1.remove('')
            if len(icontent1) >= 5:
                if icontent1[-1] == 'LAT/LON1/LON2/DLON/H\n' and num <= counLat and count <= 13:
                    deltla = 2.5
                    deltlo = 5
                    num1 = num1 + 1
                    lat0 = Lat0 - (deltla * num1)
                    print(num1)
                    print(lat0)
                    if num1 <= numlat:
                        if lat0 >= Latdown and  lat0 <= Latup:
                            lat.append(lat0)
                            num = num + 1
                            '''
                            Begin putting TEC value into TEC list
                            '''
                            ynum = 0
                            for y in range(1,6):
                                print('xxx')
                                tecvalue1 = icontent0[i+y].split(' ')
                                for z in range(tecvalue1.count('')):
                                    tecvalue1.remove('')
                                for lo in range(len(tecvalue1)):
                                    if (Lon0 >= Londown) and (Lon0 <= Lonup):
                                        print(tecvalue1[lo])
                                        lon.append(Lon0)
                                        TEC2D[num-2][ynum] = int(tecvalue1[lo])
                                        ynum = ynum + 1
                                    Lon0 = Lon0 + deltlo
                            Lon0 = -180
                    elif (num1 > numlat) and num1 <= (71- numlat):
                        pass
                    if num >= (counLat+1):
                        if num1 <= numlat:
                            timenum = timenum + 1
                            lonfin = list(set(lon))
                            lonfin.sort(key=lon.index)
                            print(lonfin)
                            print(lat)
                            LON,LAT = np.meshgrid(lonfin,lat)
                            plt.figure()
                            plt.contourf(LON, LAT, TEC2D, 8, cmap='plasma')
                            C = plt.contour(LON, LAT, TEC2D,  8, cmap='plasma')
                            # 添加标记,标记处不显示轮廓线,颜色为黑色,保留两位小数
                            plt.clabel(C, inline=True, colors='k', fmt='%1.2f')
                            path = 'F:/contour-outcome-region'+'/'+str(picnum)+'/'
                            if not os.path.exists(path):  # 如果不存在路径,则创建这个路径
                                os.makedirs(path)
                            plt.savefig(path+'/'+str(timenum)+'.jpg')
                            plt.close()
                        elif (num1 > numlat) and num1 <= 71:
                            print('elif')
                            pass
                        else:
                            print('else')
                            num = 1
                            num1 = 0
                            count = count + 1
                            lon.clear()
                            lat.clear()
                            TEC = list(TEC)
                            TEC.clear()
                            TEC2D = np.zeros(shape=(counLat,counLon))
                            Lon0 = -180.0
                            Lat0 = 90

    picnum = picnum + 1
    lon.clear()
    lat.clear()
    TEC.clear()
    TEC2D = np.zeros(shape=(counLat,counLon))
    Lon0 = -180.0
    Lat0 = 90


 197
197


 被折叠的 条评论
为什么被折叠?
被折叠的 条评论
为什么被折叠?
 到【灌水乐园】发言


