


QtGraphs
September 23, 2024 by Sami Varanka | Comments
2024年9月23日:萨米·瓦兰卡,评论
This blog post introduces Qt's newest module for visualizing data in both 2D and 3D graphs. Named QtGraphs, it will officially move out of tech preview with the release of Qt 6.8. This module integrates 2D and 3D data visualization into a single package, effectively replacing the older QtCharts and QtDataVisualization modules, which were introduced in the early Qt 5 era. By combining these modules, it becomes more intuitive and convenient for users to locate the appropriate module for all their data visualization requirements.
这篇博客文章介绍了Qt用于在2D和3D图形中可视化数据的最新模块。命名为QtGraphs,它将随着Qt 6.8的发布正式退出技术预览版。该模块将2D和3D数据可视化集成到一个软件包中,有效地取代了Qt 5早期引入的旧QtScharts和QtDataVisualization模块。通过组合这些模块,用户可以更直观、更方便地找到满足其所有数据可视化需求的适当模块。
Improvements in rendering
渲染的改进
When the 3D data visualization module was created, Qt didn't have the sophisticated graphics abstraction and 3D rendering engine it does today. Therefore, a custom-built OpenGL rendering engine was created solely for the QtDataVisualization. The rendering engine needed to work with devices using OpenGL ES 2 and thus lacked modern OpenGL features, such as instanced rendering. Moreover, since the rendering engine used OpenGL, Ui components were also required to use OpenGL. Forcing applications to use OpenGL led to suboptimal performance on platforms having better graphics alternatives, such as Direct3D on Windows. QtGraphs' 3D side is not restricted to just OpenGL since it uses Quick3D to visualize the graphs. QtCharts was highly coupled with the Widget framework as it used the graphics view framework. This usually meant using a software rendering solution. However, as QtGraphs works on the Quick framework, the 2D graphs use hardware-accelerated rendering.
当创建3D数据可视化模块时,Qt没有像今天这样复杂的图形抽象和3D渲染引擎。因此,专门为QtDataVisualization创建了一个定制的OpenGL渲染引擎。渲染引擎需要与使用OpenGL ES 2的设备一起工作,因此缺乏现代OpenGL功能,如实例化渲染。此外,由于渲染引擎使用OpenGL,Ui组件也需要使用OpenGL。强制应用程序使用OpenGL会导致在具有更好图形替代方案的平台上性能不佳,例如Windows上的Direct3D。QtGraphs的3D端不仅限于OpenGL,因为它使用Quick3D来可视化图形。QtCharts与Widget框架高度耦合,因为它使用图形视图框架。这通常意味着使用软件渲染解决方案。然而,由于QtGraphs在Quick框架上工作,2D图形使用硬件加速渲染。
Changes to 3D data APIs
3D数据API的更改
The changes between QtDataVisualization and QtGraphs are not only under the hood since major rework has been done on data APIs. Old APIs required heap allocation of new data arrays. Now, however, all data can be allocated in the stack, and move semantics are utilized to avoid unnecessarily copying data. In addition to these API changes, the usage of proxies has now been clarified. In QtDataVisualization, the proxies contained the data supplied to the series. However, a proxy should not hold data but act as an intermediate layer for passing data. In QtGraphs, the data is still passed to proxies, but they give it to the series immediately rather than store it.
QtDataVisualization和QtGraphs之间的变化不仅在幕后,因为数据API已经进行了重大的修改。旧的API需要堆分配新的数据数组。然而,现在所有数据都可以在堆栈中分配,并利用移动语义来避免不必要的复制数据。除了这些API更改之外,代理的使用现在已经得到澄清。在QtDataVisualization中,代理包含提供给系列的数据。但是,代理不应该保存数据,而应该充当传递数据的中间层。在QtGraphs中,数据仍然会传递给代理,但它们会立即将其传递给序列,而不是存储它。
Widget support
Widget支持
QtGraphs can still be used with widgets like QtDataVisualization. However, there are some differences. As Quick3D uses Quick rendering infrastructure, QQuickWidgets should be used instead of plain QWidgets. While QtGraphs was in TP, every graph inherited from QQuickWidget. However, that design was suboptimal since it created a hard dependency on the widget framework. Therefore, the design was changed to use composition rather than inheritance.
QtGraphs仍然可以与QtDataVisualization等Widget一起使用。然而,也存在一些差异。由于Quick3D使用Quick渲染基础设施,因此应使用QQuickWidgets而不是普通的QWidgets。当QtGraphs在TP中时,每个图都继承自QQuickWidget。然而,这种设计并不理想,因为它对小部件框架产生了硬依赖。因此,设计被更改为使用组合而不是继承。
Interaction
交互
QtGraphs retains the same interaction methods for 3D graphs as QtDataVisualization, but their implementation has been greatly simplified. Previously, QtDataVisualization used QAbstract3DInputHandler, QInput3DHandler, and QTouch3DInputHandler. Now, there is a single class, QGraphsInputHandler, that consolidates all quick input handlers. While QtCharts translated events from QuickItem to graphics scene events, the 2D side in QtGraphs can now directly use events from QQuickItem.
QtGraphs保留了与QtDataVisualization相同的3D图交互方法,但它们的实现大大简化了。以前,QtDataVisualization使用QAbstract3DInputHandler、QInput3DHandler和QTouch3DInputHandler。现在,有一个类QGraphsInputHandler,它整合了所有快速输入处理程序。虽然QtScharts将事件从QuickItem转换为图形场景事件,但QtGraphs中的2D端现在可以直接使用QQuickItem中的事件。
Changes to theming
主题更改
Previously, a theme had too much power over the visual aspects of the application, such as colors, visibilities, lighting, and font. For example, by setting a theme with light colors, all of the graph's colors could be changed to light colors, even if the platform uses a dark scheme. In QtGraphs, the Q3DTheme type has been replaced by QGraphsTheme and it is used by both 2D and 3D. The QGraphsTheme has been separated into two distinct logical parts: color scheme and theme.
以前,主题对应用程序的视觉方面(如颜色、可见性、照明和字体)有太大的影响力。例如,通过将主题设置为浅色,即使平台使用深色方案,图形的所有颜色也可以更改为浅色。在QtGraphs中,Q3DTheme类型已被QGraphsTheme替换,它既可用于2D,也可用于3D。QGraphsTheme分为两个不同的逻辑部分:配色方案和主题。
Color scheme controls colors outside the main graph object, such as background, plot area, grid line, label background, and text. The color scheme has three values: light, dark, and automatic. An automatic color scheme follows the platform's color scheme. Our UX team has modernized color schemes and all the preset themes to follow today's standards used in Qt.
配色方案控制主图形对象之外的颜色,如背景、绘图区域、网格线、标签背景和文本。配色方案有三个值:亮、暗和自动。自动配色方案遵循平台的配色方案。我们的用户体验团队已经对配色方案和所有预设主题进行了现代化改造,以遵循Qt中使用的当今标准。
New features
新特性
With QtGraphs3D being implemented with QQuick3D which enables some new features.
随着QtGraphs3D与QQuick3D一起实现,它启用了一些新功能。
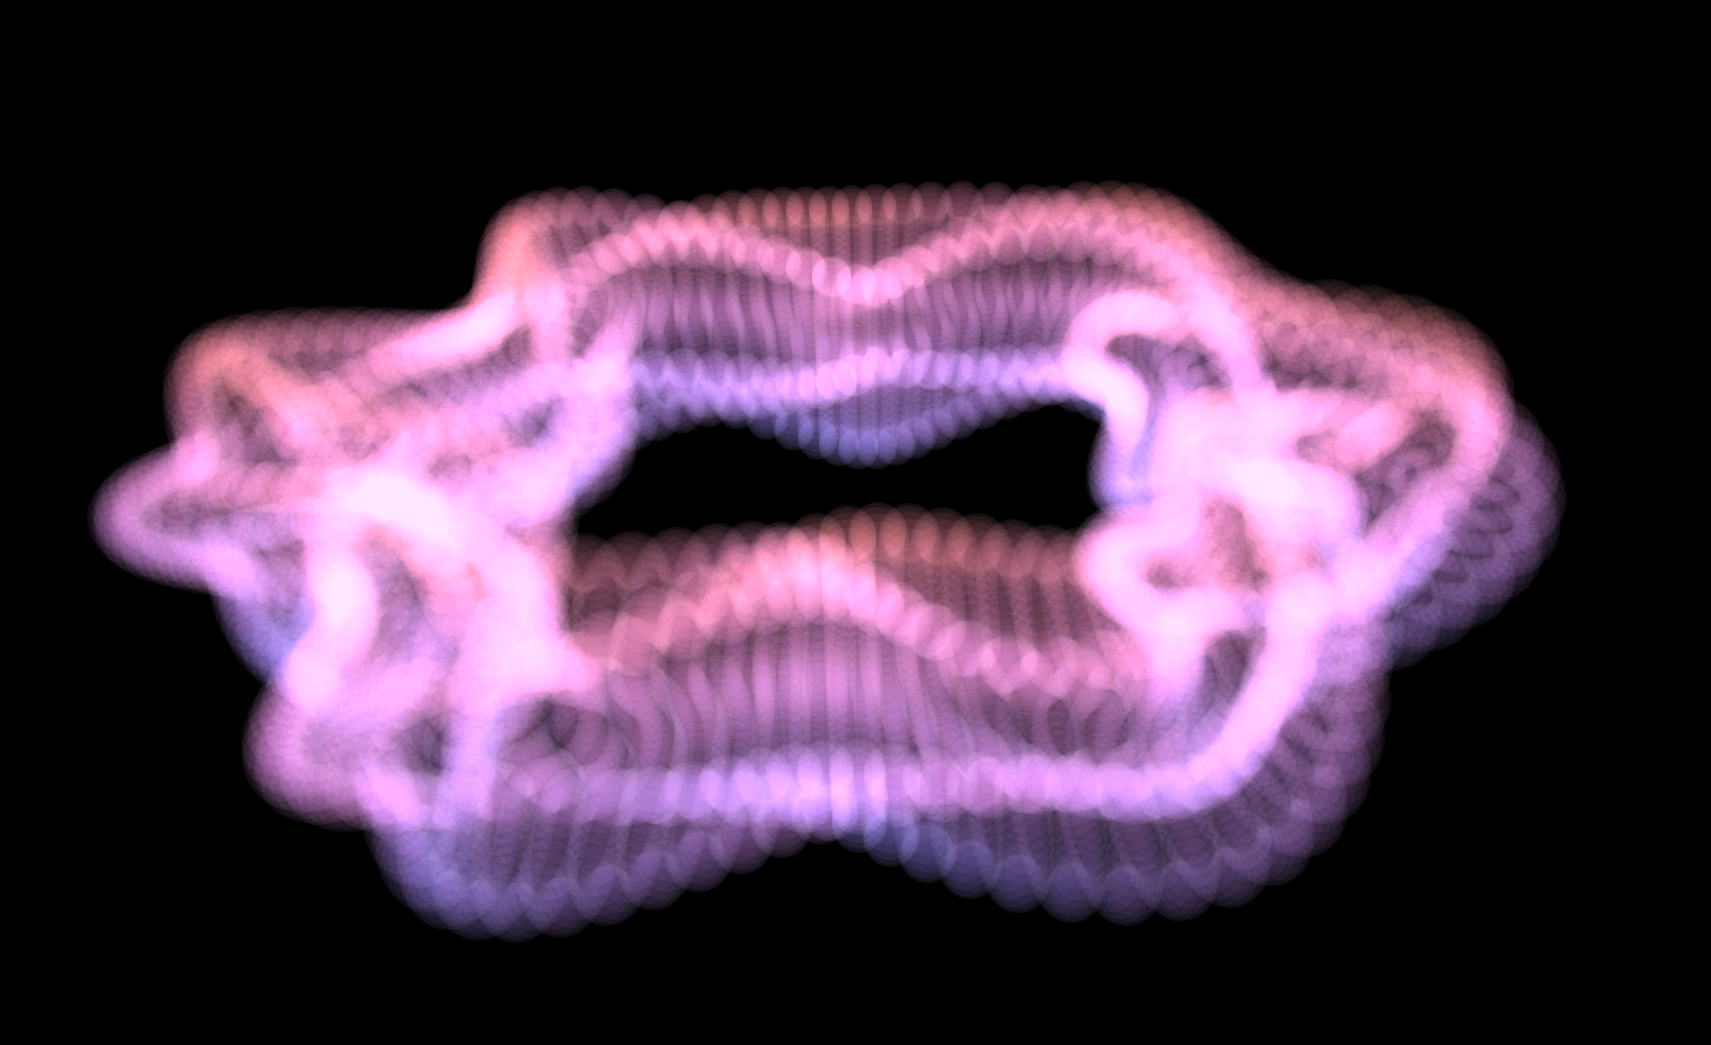
We are now able to integrate other QQuick3D elements into graphs. Using the importScene property we are able to add any collection of models, lights, particle emitters, and reflection probes into the graphs scene. Similarly, we are also able to extend the scene environment for using e.g. tone mapping modes, post processing effects, or skyboxes. This can allow for some interesting scenes.
我们现在能够将其他QQuick3D元素集成到图形中。使用importScene属性,我们能够将任何模型、灯光、粒子发射器和反射探测器的集合添加到图形场景中。同样,我们还可以扩展场景环境,以使用例如色调映射模式、后处理效果或天空盒。这可以允许一些有趣的场景。
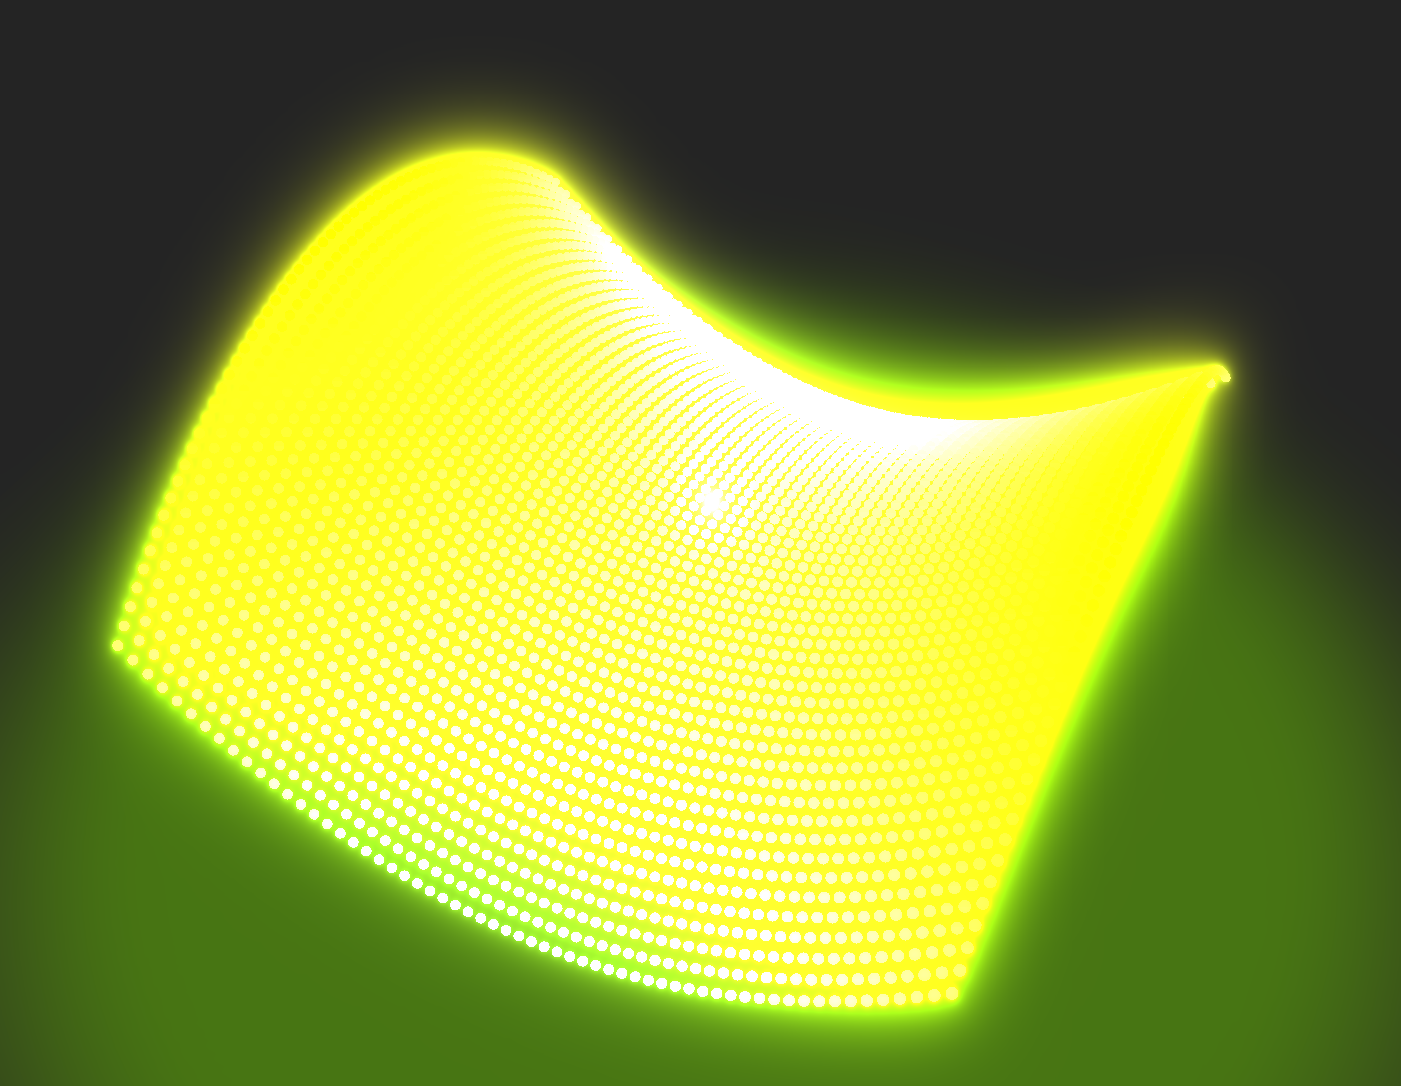
QtGraphs now also supports transparency for Bars3D and Scatter3D. Transparency for Surface3D is currently not being supported due to a known issue but will be added later.
QtGraphs现在还支持Bars3D和Scatter3D的透明度。由于已知问题,目前不支持Surface3D的透明度,但稍后将添加。
3D Graphs Performance
3D图形性能
With QtGraphs, there has been a concerted effort to enhance the performance of all 3D graph types. For bar and scatter graphs, we can now utilize the model instancing capabilities provided by QtQuick3D to efficiently display a large number of bars or points. QtGraphs still supports non-instanced rendering, which can be enabled using the optimizationHint:Legacy property. For surface graphs, we have shifted the task of vertex positioning to the vertex shader, harnessing the GPU's power for this operation.
有了QtGraphs,人们一直在共同努力提高所有3D图形类型的性能。对于条形图和散点图,我们现在可以利用QtQuick3D提供的模型实例化功能来有效地显示大量条形图或点。QtGraphs仍然支持非实例化渲染,可以使用optimizationHint:Legacy属性启用。对于曲面图,我们已将顶点定位的任务转移到顶点着色器,利用GPU的强大功能进行此操作。
To verify the improvements, we devised a performance test. The test instantiates a graph starting at 100 points and with continuously changing data. The FPS of the scene is measured for a fixed amount of time after which the measures are aggregated. The number of points in the graph is then incremented, and the graph FPS is remeasured. This procedure is run for each graph type.
为了验证这些改进,我们设计了一个性能测试。该测试实例化了一个从100个点开始、数据不断变化的图。在固定时间内测量场景的FPS,之后对测量值进行聚合。然后,图中的点数递增,并重新测量图FPS。此过程针对每种图形类型运行。
Bar and Scatter graphs in QtGraphs were run both in instanced and non-instanced configurations while
while Static and Dynamic configurations were used in QtDataVizualization.
QtGraphs中的条形图和散点图在实例化和非实例化配置中运行,而QtDataVizualization中使用静态和动态配置。
The test was run on a Linux machine with an Intel I7-8700 CPU and NVIDIA Quadro 4000 GPU.
OpenGL was used as the RHI backend for QtGraphs, and VSync was turned off for all tests.
MSAA was set to 4X, and Shadows were turned off for the tests.
该测试在配备Intel I7-8700 CPU和NVIDIA Quadro 4000 GPU的Linux机器上运行。
OpenGL被用作QtGraphs的RHI后端,所有测试都关闭了VSync。
MSAA设置为4X,测试时关闭了阴影。
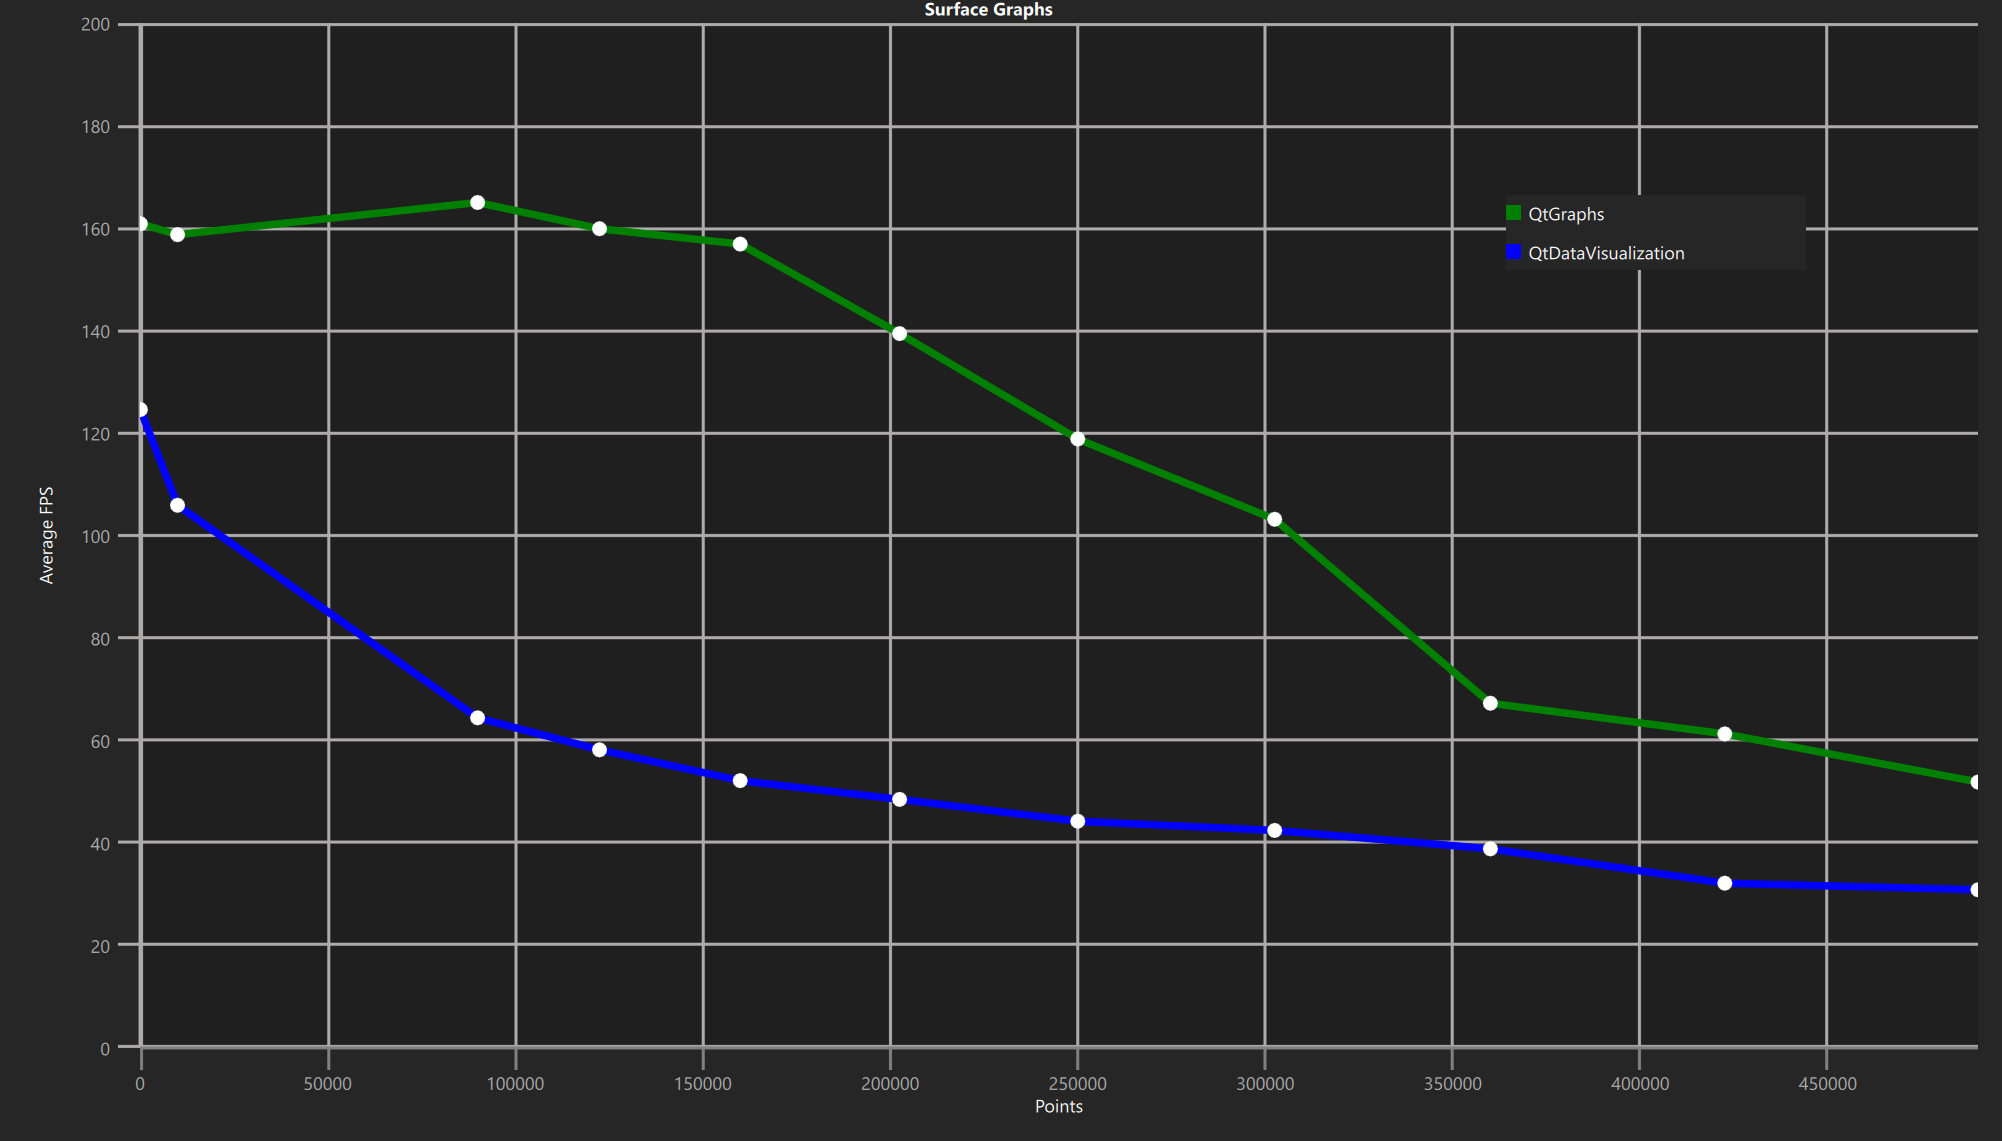
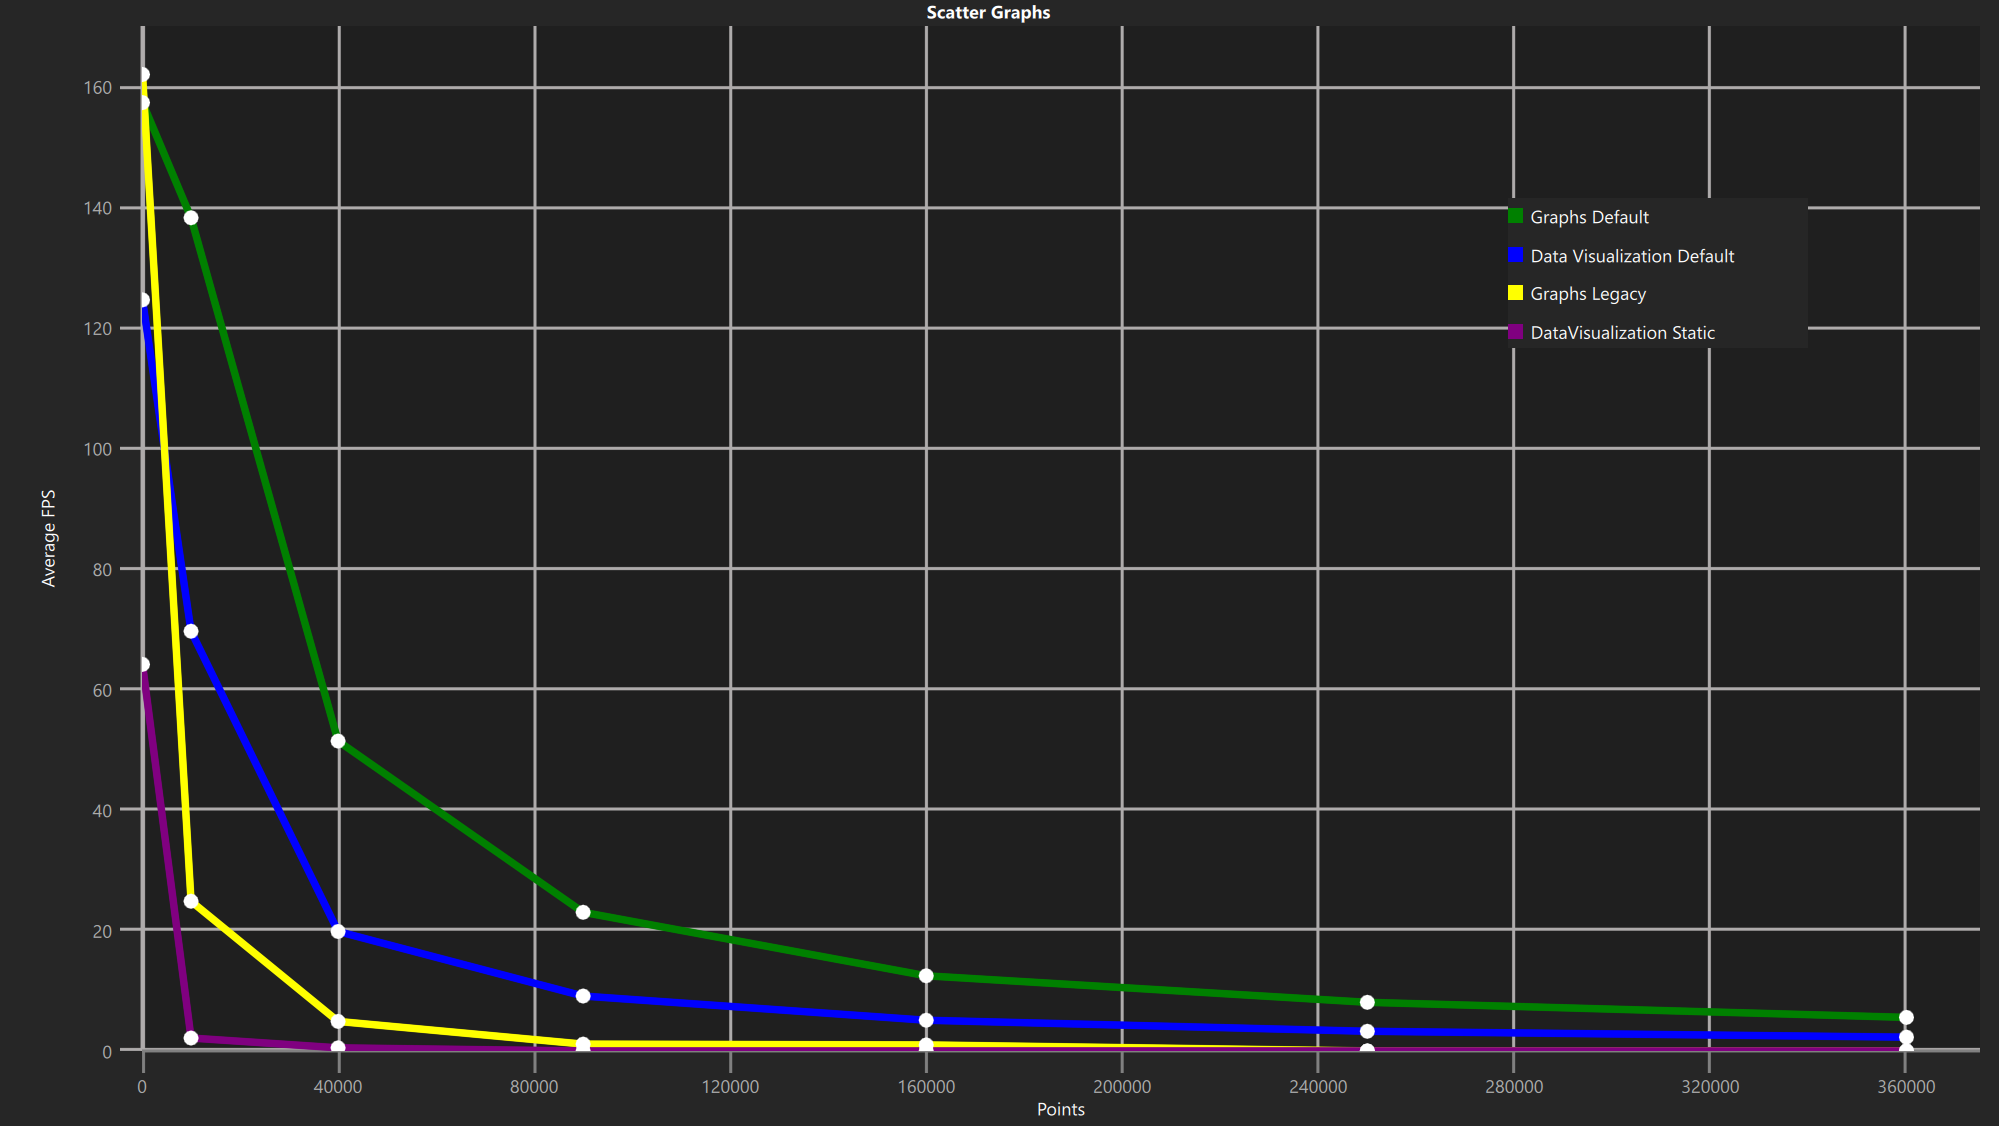
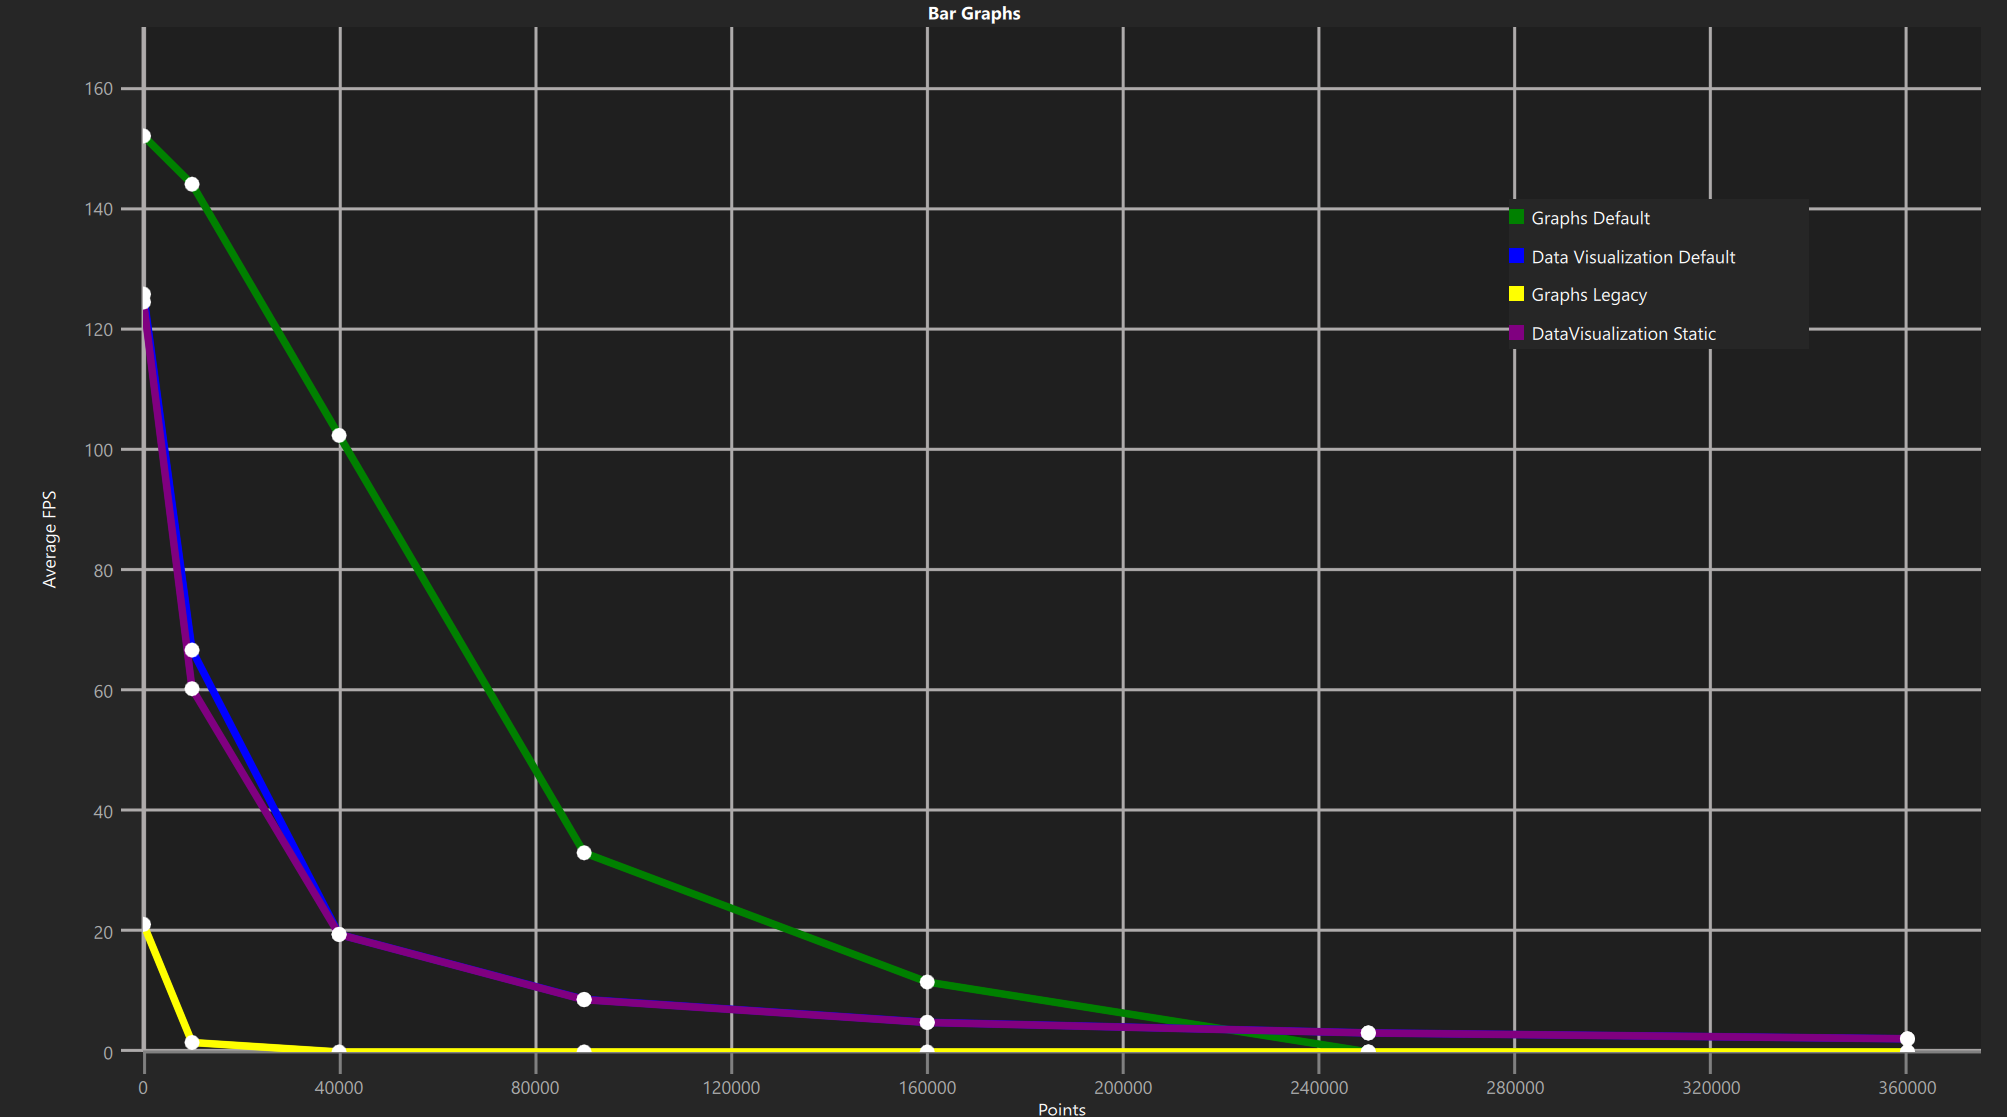
While the Legacy configuration of 3D Graphs performs weaker than default Data Visualization, the average FPS for each graph is notably higher for the default configuration of 3D Graphs, suggesting that the new techniques are effective in increasing performance.
虽然3D图形的传统配置的性能弱于默认的数据可视化,但3D图形的默认配置的每个图形的平均FPS明显更高,这表明新技术在提高性能方面是有效的。
Future development
未来发展
QtGraphs will continue development with new requested features already being contemplated. For instance, while embedding 3D elements into graphs is possible, it is not yet possible to embed graphs into QQuick3D Scenes. Parametric spline rendering is another requested feature already in the works. For 2D, one upcoming feature is the possibility of changing whether the x-axis is displayed on the top or bottom side of the graph. In the same way, the y-axis can be changed from left to right.
QtGraphs将继续开发,并已考虑提供新的功能。例如,虽然可以将3D元素嵌入到图形中,但还不可能将图形嵌入到QQuick3D场景中。参数样条线渲染是另一个已在开发中的请求功能。对于2D,一个即将推出的功能是可以更改x轴是显示在图形的顶部还是底部。同样,y轴可以从左向右改变。


 3014
3014

 被折叠的 条评论
为什么被折叠?
被折叠的 条评论
为什么被折叠?
 到【灌水乐园】发言


