


版权声明:本文为博主原创文章,未经博主允许不得转载。
看到很多人在论坛求助 毕业设计或者其他课题中的图表应用,最简单的就是mschart 但它有很多缺点 网上教程一大把 这里说下codeproject上的 HiSpeedChart控件 用起来也是很简单的。
源地址在这里http://www.codeproject.com/KB/miscctrl/High-speedCharting.aspx
以对话框应用为例
1添加.h .cpp进入工程,然后在Cxxdlg.h里添加
- #include "ChartCtrl_source/ChartCtrl.h"
- #include "ChartCtrl_source/ChartLineSerie.h"
和
- public:
- CChartCtrl m_Chart;
- CChartLineSerie* pLineSerie;
同时在resource.h里添加
- #define IDC_CHARTCTRL 1001
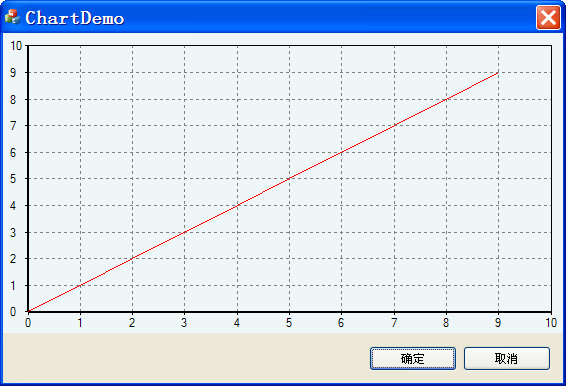
2Cxxdlg.cpp里OnInitDialog()添加
- CRect rc;
- GetClientRect(rc);
- rc.bottom -= 50;
- m_Chart.Create(this,rc,IDC_CHARTCTRL);
- m_Chart.SetEdgeType(0);
- m_Chart.SetBackColor(RGB(239,246,248));
- CChartStandardAxis* pBottomAxis =
- m_Chart.CreateStandardAxis(CChartCtrl::BottomAxis);
- pBottomAxis->SetMinMax(0, 10);
- CChartStandardAxis* pLeftAxis =
- m_Chart.CreateStandardAxis(CChartCtrl::LeftAxis);
- pLeftAxis->SetMinMax(0, 10);
- pLineSerie = m_Chart.CreateLineSerie();
- double XValues[10],YValues[10];
- for (int i=0;i<10;i++)
- {
- XValues[i] = YValues[i] = i;
- }
- pLineSerie = m_Chart.CreateLineSerie();
- pLineSerie->SetPoints(XValues,YValues,10);
- pLineSerie->SetColor(RGB(255,0,0));
ok end
-------------------------------------2014.12.26-----------------------------
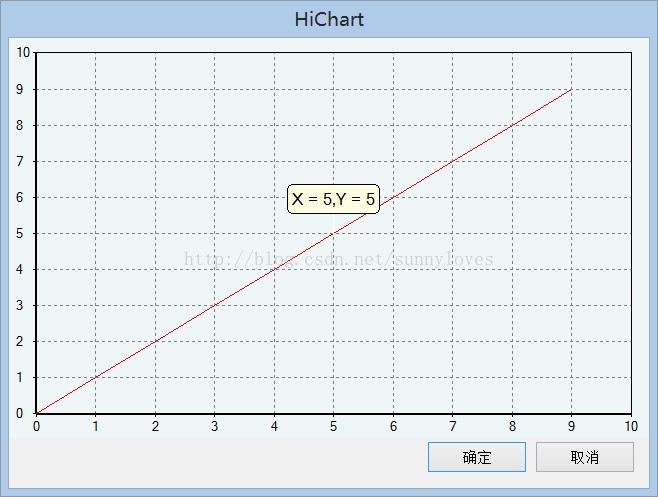
给曲线添加个label标签也比较简单,记录如下
第一种是静态标签, 在上面代码的基础上添加一句
- pLineSerie->CreateBalloonLabel(5,_T("X = 5,Y = 5"));
=================================================================================
2014.12.27经常有需要实时显示曲线坐标点数字的功能,在这个类里实现比较方便,先看效果图
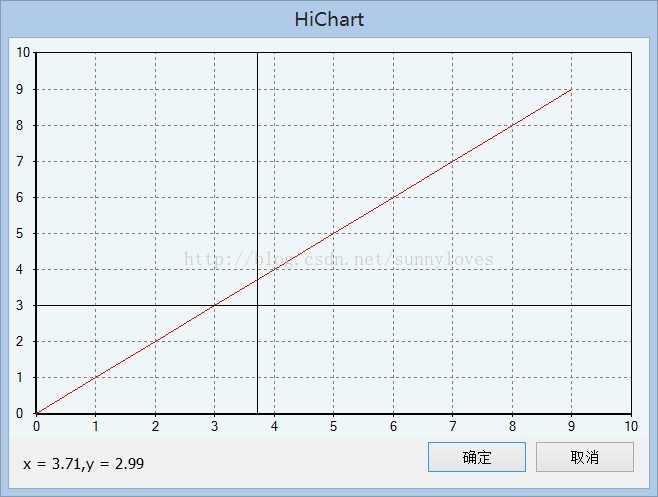
这里主要用Cursor的属性。从CChartCursor派生是最好的方法,这里这样派生
- class CCustomCursorListener : public CChartCursorListener
- {
- public:
- void OnCursorMoved(CChartCursor *pCursor, double xValue, double yValue)
- {
- // TChartStringStream ssText;
- // ssText << _T("Cursor moved: xPos=") << xValue << _T(", yPos=") << yValue;
- // TChartString strText = ssText.str();
- // MessageBox(NULL,strText.c_str(), _T("Info"), MB_OK);
- x = xValue;
- y = yValue;
- SendMessage(m_hwnd,MESSAGE_UPDATEPOS,0,0);
- // Do something with the string...
- }
- void GetHwnd(HWND hwnd)
- {
- m_hwnd = hwnd;
- }
- HWND m_hwnd;
- };
为了传递出鼠标移动的消息,需要获得主窗口的句柄,添加了GetHwnd函数。
同时在工程里添加全局变量double x,y;dlg.h里添加
- CCustomCursorListener* m_pCursorListener;
- <span style="white-space:pre"> </span>afx_msg LRESULT OnUpdateData(WPARAM wp,LPARAM lp);
- ON_MESSAGE(MESSAGE_UPDATEPOS,OnUpdateData)
- CChartCrossHairCursor* pCrossHair =
- m_Chart.CreateCrossHairCursor();
- HWND hWnd = this->GetSafeHwnd();
- m_pCursorListener = new CCustomCursorListener;
- m_pCursorListener->GetHwnd(hWnd);
- pCrossHair->RegisterListener(m_pCursorListener);
- LRESULT CHiChartDlg::OnUpdateData(WPARAM wp,LPARAM lp)
- {
- CString s;
- s.Format(_T("x = %.2f,y = %.2f"),x,y);
- CStatic* pStatic;
- pStatic = (CStatic*)GetDlgItem(IDC_STATIC);
- pStatic->SetWindowText(s);
- return 1;
- }
就可以实现了
-
顶
- 0
-
踩
- 0


 4998
4998

 被折叠的 条评论
为什么被折叠?
被折叠的 条评论
为什么被折叠?
 到【灌水乐园】发言


