Python绘制圆锥曲线动画
圆锥曲线非常适合进行动态演示,尤其是其中优美的几何关系,更能在动态变化中得到淋漓尽致的表现。本文探讨了圆锥曲线的动画绘制方法。
三种圆锥曲线的方程分别如下:
| 椭圆 | 双曲线 | 抛物线 |
|---|---|---|
| x 2 a + y 2 b \frac{x^2}{a}+\frac{y^2}{b} ax2+by2=1 | x 2 a − y 2 b \frac{x^2}{a}-\frac{y^2}{b} ax2−by2=1 | y 2 = 2 p x y y^2=2pxy y2=2pxy |
在Python中,绘制动图需要用到matplotlib中的animation包,其调用方法以及接下来要用到的参数为
ani = animation.FuncAnimation(fig, func, frames, interval)
其中fig为绘图窗口,func为绘图函数,其返回值为图像,frames为迭代参数,如果为整型的话,其迭代参数则为range(frames)。
编制一个绘制圆锥曲线动画的类:
#导入依赖包
import numpy as np
import matplotlib.pyplot as plt
import matplotlib.animation as animation

#绘制圆锥曲线动画
class drawAni():
    # func为参数方程
    def __init__(self,lineFunc,traceFunc,txtFunc,ts,xlim,ylim,figsize=(16,9),iniFunc=None):
        self.lineFunc = lineFunc
        self.traceFunc = traceFunc
        self.txtFunc = txtFunc
        self.iniFunc = iniFunc
        self.fig = plt.figure(figsize=figsize)
        ax = self.fig.add_subplot(autoscale_on=False,
            xlim=xlim,ylim=ylim)
        ax.grid()
        if iniFunc:
            initFunc(ax)

        #把x、y刻度线移到(0,0)为中心的数据区域
        ax.spines['right'].set_color('none')           #用spines设置颜色值为none,把右刻度线隐掉
        ax.spines['top'].set_color('none')            #用spines设置颜色值为none,把顶刻度线隐掉
        ax.xaxis.set_ticks_position('bottom')         #把x轴刻度线位置设置为bottom
        ax.spines['bottom'].set_position(('data',0))     #把底部的刻度线设置到数据区域的0位置
        ax.yaxis.set_ticks_position('left')            #把y轴刻度线位置设置为left
        ax.spines['left'].set_position(('data',0))        #把左部的刻度线设置到数据区域的0位置

        self.line, = ax.plot([],[],'o-',lw=2)
        self.trace, = ax.plot([],[],'-',lw=1)
        self.text = ax.text(0.02,0.85,'',transform=ax.transAxes)
        self.xs, self.ys, self.ts = [],[],ts
        self.run(ts)
    def animate(self,t):
        if(t==self.ts[0]):
            self.xs, self.ys = [],[]
        x,y = self.traceFunc(t)
        self.xs.append(x)
        self.ys.append(y)
        self.line.set_data(self.lineFunc(x,y))
        self.trace.set_data(self.xs,self.ys)
        self.text.set_text(self.txtFunc(t))
        return self.line, self.trace, self.text
    def run(self,ts):
        self.ani = animation.FuncAnimation(self.fig, self.animate, ts, interval=5, blit=True)
        plt.subplots_adjust(left=0.05, right=0.95, top=0.95, bottom=0.05)
        plt.show()
    def save(self,saveName):
        self.ani.save(saveName)
1.椭圆
为了绘图方便,故将椭圆写为参数方程
{
x
=
a
∗
c
o
s
t
y
=
b
∗
s
i
n
t
\begin{cases}x=a*cost\\y=b*sint\end{cases}
{x=a∗costy=b∗sint
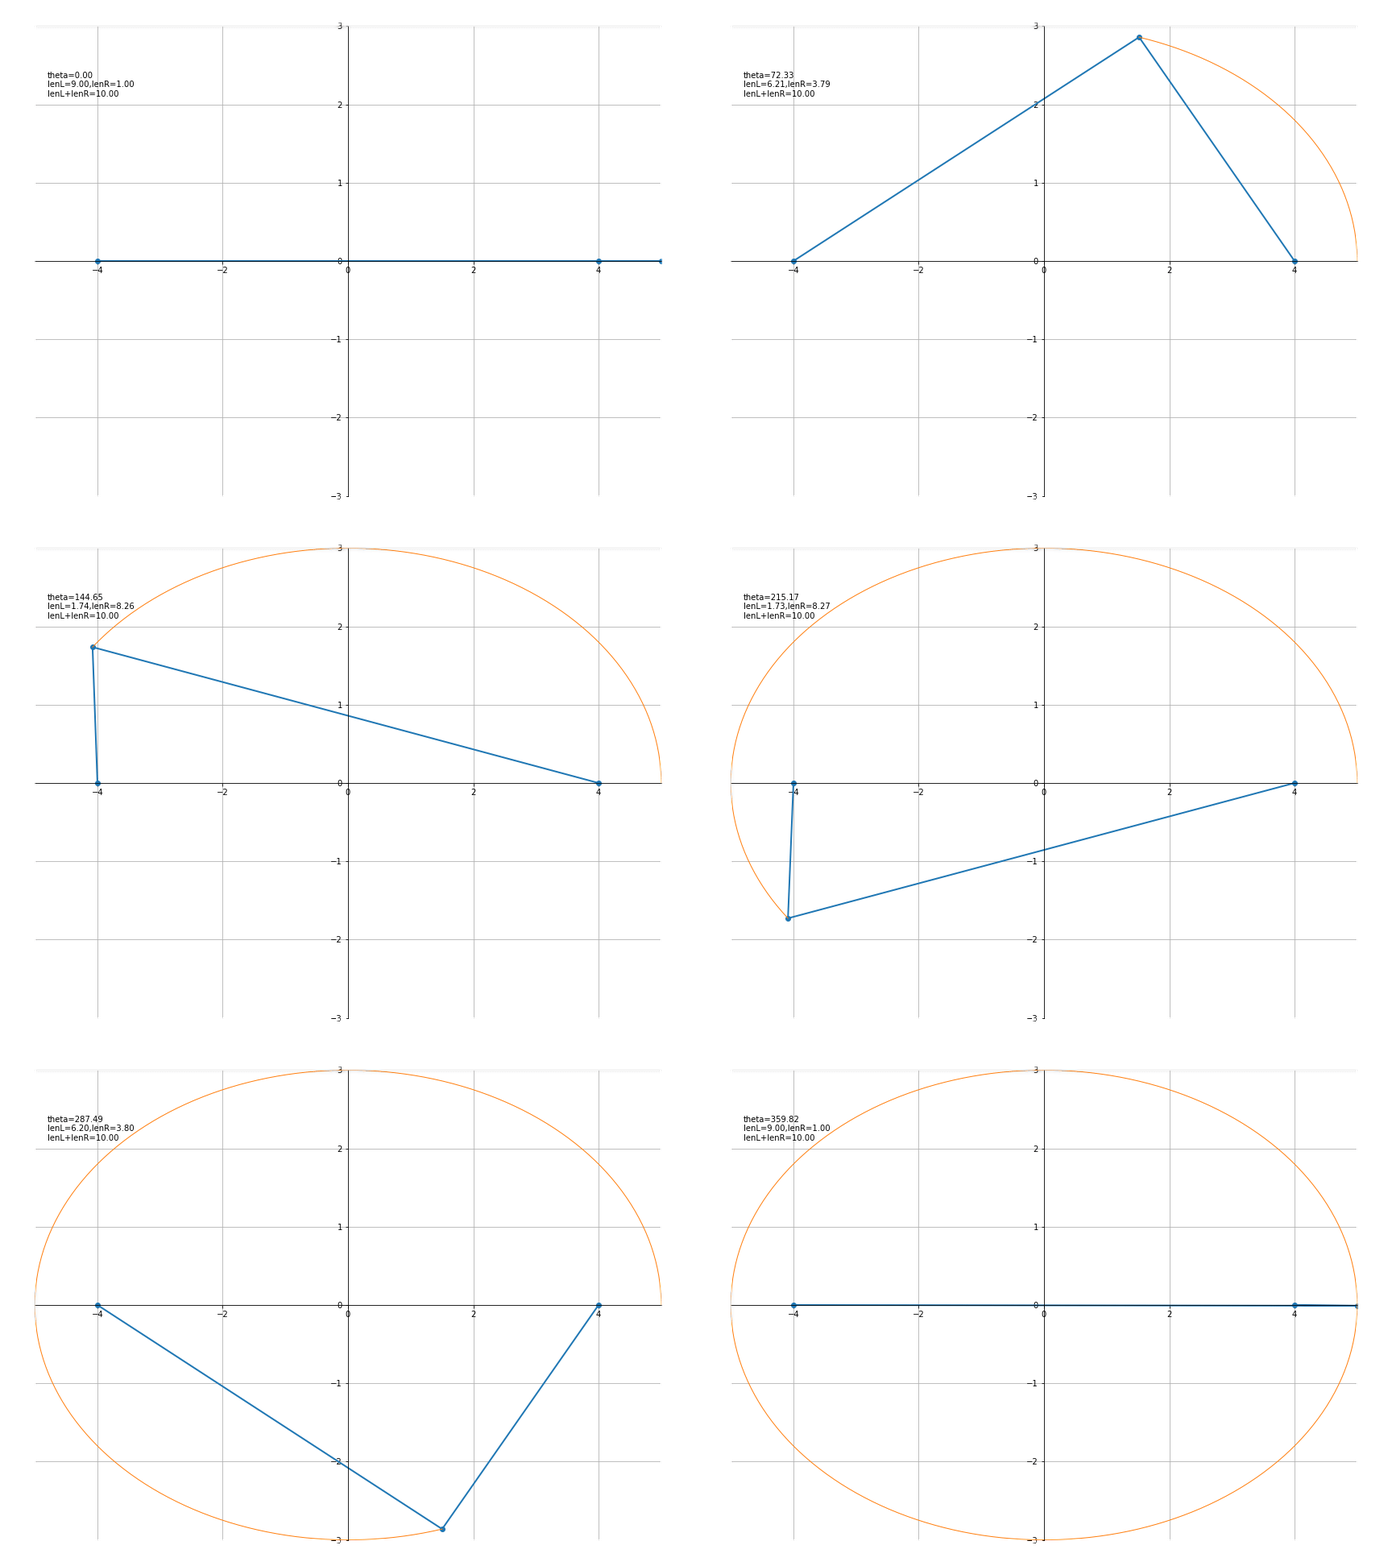
设a = 5 , b = 3 , c = 4,则焦点为( 4 , 0 ) , ( − 4 , 0 ),则有

代码如下:
a,b,c = 5,3,4

def traceFunc(theta):
    x = a*np.cos(theta)
    y = b*np.sin(theta)
    return x,y

def lineFunc(x,y):
    return [-c,x,c], [0,y,0]

def txtFunc(theta):
    th = 180*theta/np.pi
    x,y = traceFunc(theta)
    lenL = np.sqrt((x+c)**2+y**2)
    lenR = np.sqrt((x-c)**2+y**2)
    txt = f'theta={th:.2f}\nlenL={lenL:.2f},lenR={lenR:.2f}\n'
    txt += f'lenL+lenR={lenL+lenR:.2f}'
    return txt

xlim,ylim = (-a,a), (-b,b)
ts =  np.linspace(0,6.28,200)
an = drawAni(lineFunc, traceFunc, txtFunc, ts, xlim, ylim, (12,9))
an.save("ellipse.gif")
2.双曲线
双曲线的参数方程为
{
x
=
a
∗
c
h
t
=
a
∗
e
t
+
e
−
t
2
y
=
b
∗
s
h
t
=
b
∗
e
t
−
e
−
t
2
\begin{cases}x=a*cht=a*\frac{e^t+e^{-t}}{2}\\y=b*sht=b*\frac{e^t-e^{-t}}{2}\end{cases}
{x=a∗cht=a∗2et+e−ty=b∗sht=b∗2et−e−t
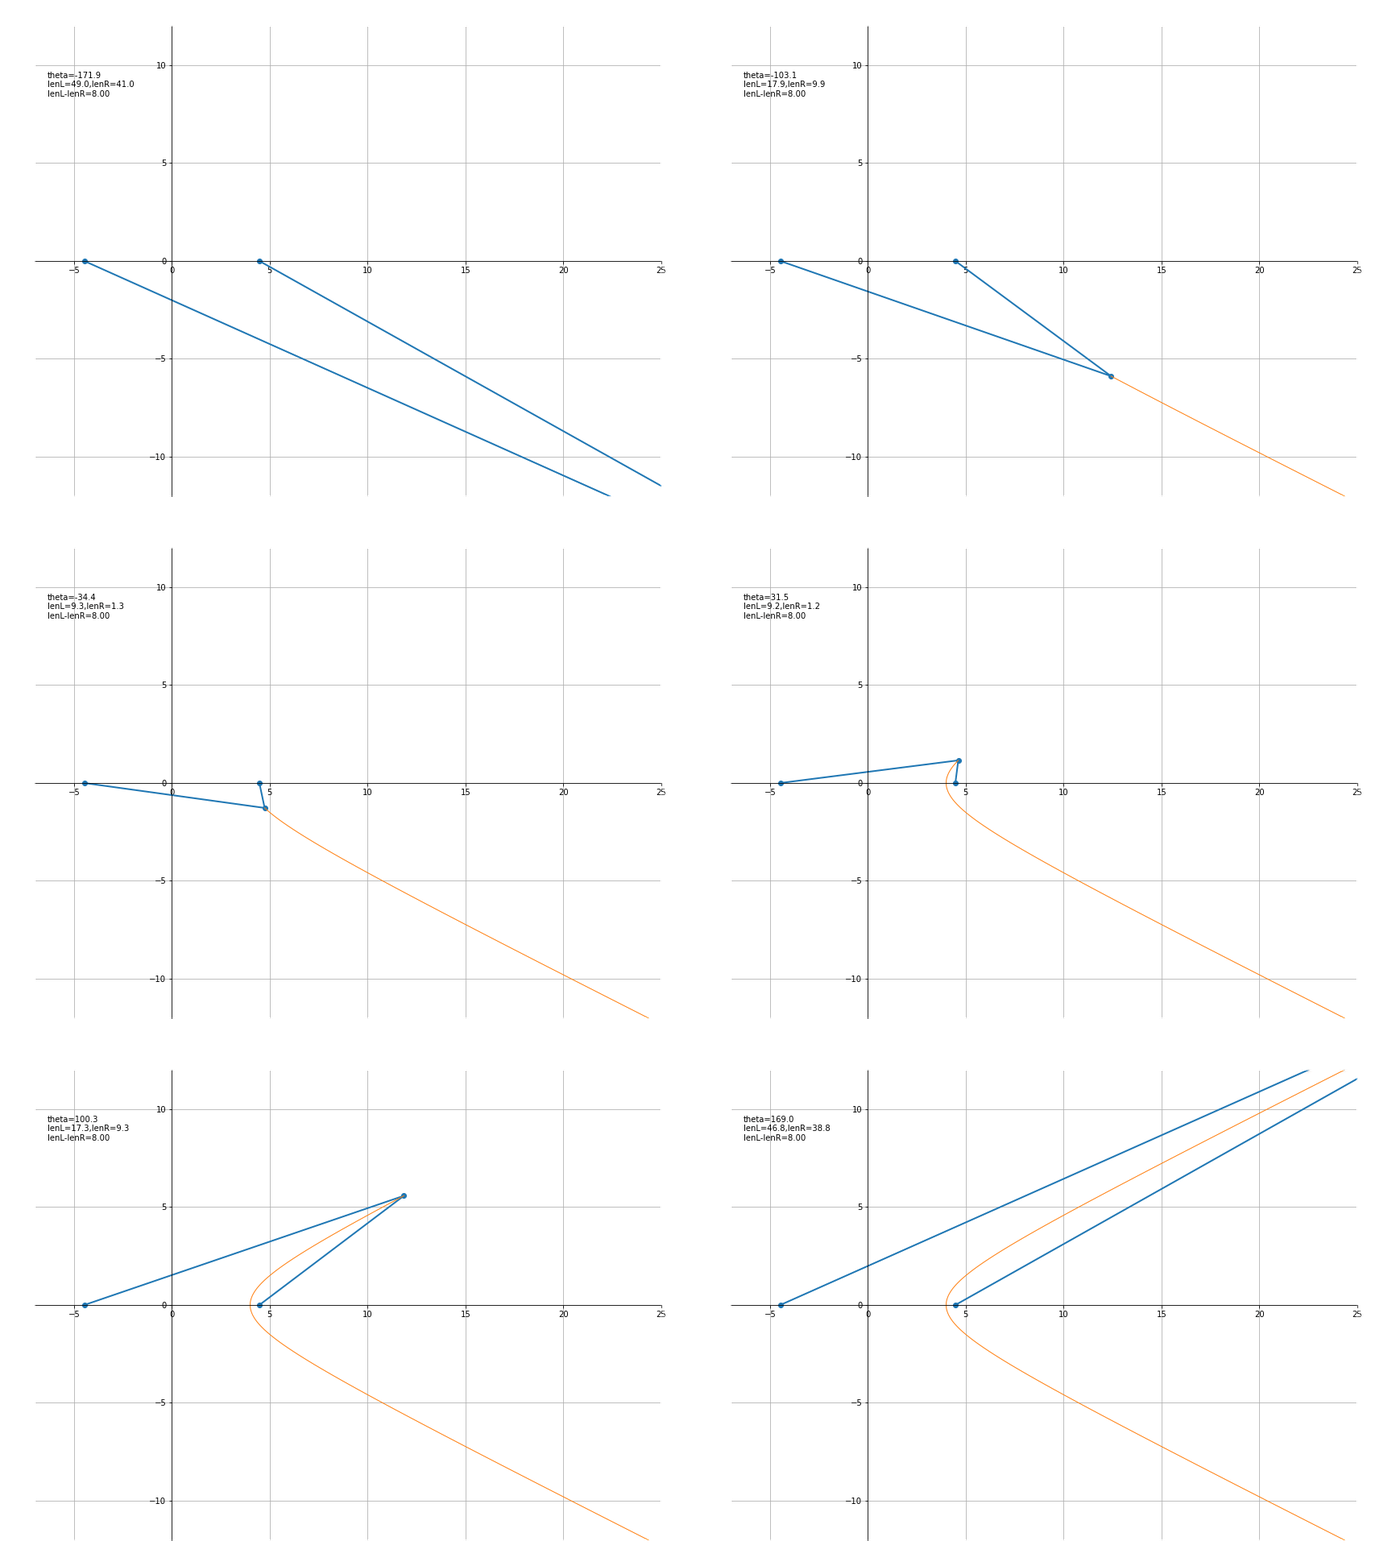
设a = 4 , b = 2,则其效果为

代码如下
a,b = 4,2
c = np.sqrt(a**2+b**2)

def traceFunc(t):
    return a*np.cosh(t), b*np.sinh(t)

def lineFunc(x,y):
    return [-c,x,c], [0,y,0]

def txtFunc(theta):
    th = 180*theta/np.pi
    x,y = traceFunc(theta)
    lenL = np.sqrt((x+c)**2+y**2)
    lenR = np.sqrt((x-c)**2+y**2)
    txt = f'theta={th:.1f}\nlenL={lenL:.1f},lenR={lenR:.1f}\n'
    txt += f'lenL-lenR={lenL-lenR:.2f}'
    return txt

xlim,ylim = (-7,25), (-12,12)
ts = np.arange(-3,3,0.05)

an = drawAni(lineFunc, traceFunc, txtFunc, ts, xlim, ylim,(12,9))
an.save("hyperbola.gif")
3.抛物线
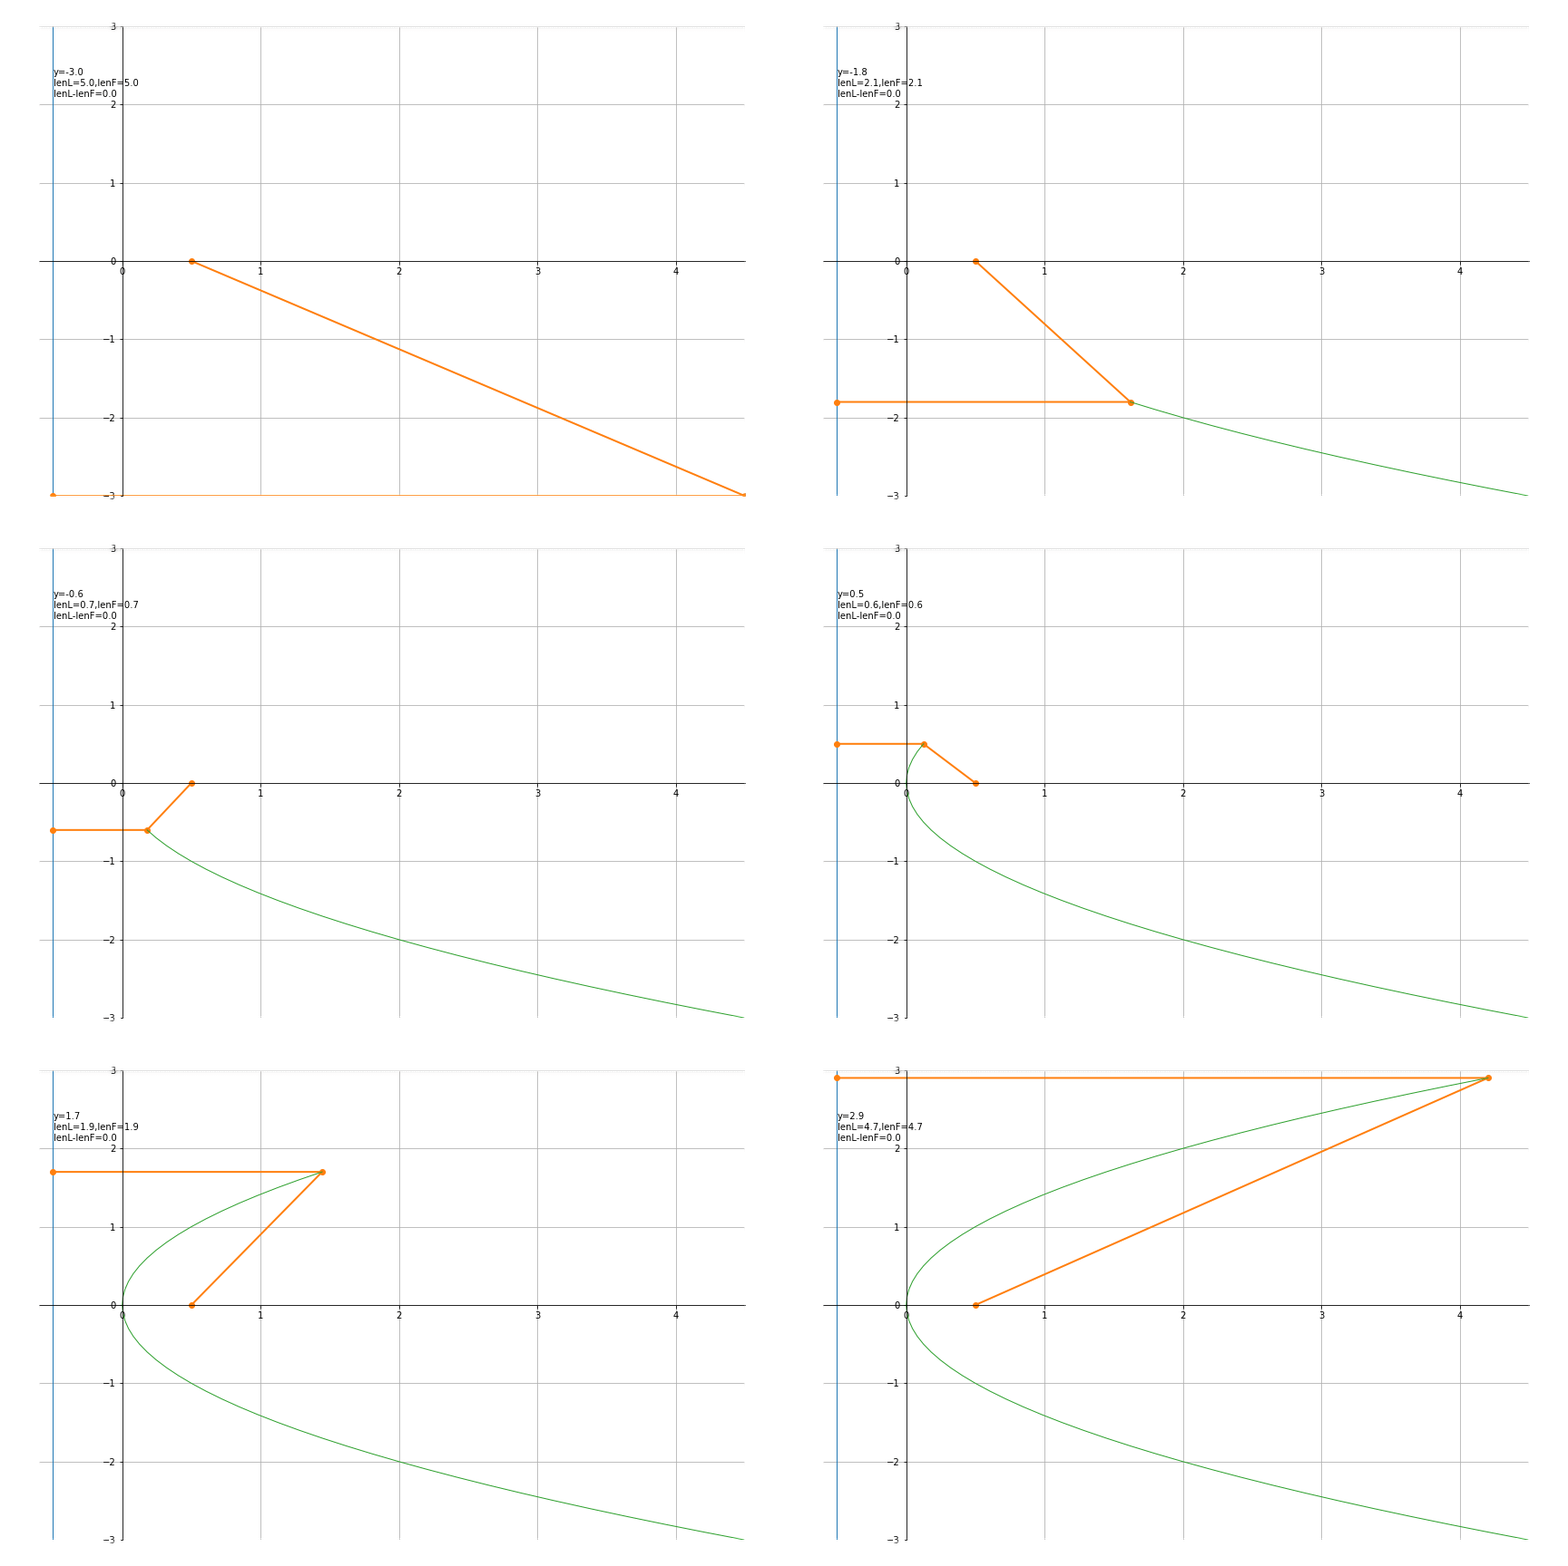
令p = 1,则焦点位置为(0, p 2 \frac{p}{2} 2p),准线为x= − p 2 -\frac{p}{2} −2p ,代码如下
p = 1
def traceFunc(y):
    return y**2/p/2, y

def lineFunc(x,y):
    return [-p/2,x,p/2], [y,y,0]

def txtFunc(theta):
    th = 180*theta/np.pi
    x,y = traceFunc(theta)
    lenL = x+p/2
    lenF = np.sqrt((x-p/2)**2+y**2)
    txt = f'y={y:.1f}\nlenL={lenL:.1f},lenF={lenF:.1f}\n'
    txt += f'lenL-lenF={lenL-lenF:.1f}'
    return txt

def initFunc(ax):
    ax.plot([-p/2,-p/2],[-3,3],'-',lw=1)

xlim,ylim=(-0.6,4.5),(-3,3)
ys = np.arange(-3,3,0.1)

an = drawAni(lineFunc, traceFunc, txtFunc, ys, xlim, ylim, (12,8), initFunc)
an.save("parabola.gif")


 本文介绍了如何使用Python的matplotlib库创建圆锥曲线(椭圆、双曲线、抛物线)的动态动画。通过参数方程,展示了如何实现动画效果,并提供了具体的代码示例,包括椭圆、双曲线和抛物线的绘制过程,最后将动画保存为gif文件。


 1126
1126

 被折叠的 条评论
为什么被折叠?


