


记录一下用SimplePolylineGeometry绘制不同颜色的多段线,代码看下面
//创建多段线和每段颜色
addColorLine(){//多颜色线段
var m= this;
//创建多段线和每段颜色 随机的
/* const positions11 = [];
const colors1= [];
for (let j = 0; j <= 50; j += 5) {
positions11.push(
Cartesian3.fromDegrees(108.94388 + j, 34.319, 5000.0 * (j % 10))
);
colors1.push(Color.fromRandom({ alpha: 1.0 }));
}*/
//设置线段的位置和颜色,一一对应,arcType为ArcType.NONE
const perSegmentPolyline = new GeometryInstance({
geometry: new SimplePolylineGeometry({
positions: m.positions,
colors: m.colorss,
arcType: ArcType.NONE,
}),
});
//使用逐顶点着色绘制多段线
//对于逐顶点着色,将colorsPerVertex选项设置为true,并为colors选项提供长度等于位置数的颜色数组
const perVertexPolyline = new GeometryInstance({
geometry: new SimplePolylineGeometry({
positions: m.positions,
colors: m.colorss,
colorsPerVertex: true,
}),
});
//添加多段线instances到primitives
m.viewer.scene.primitives.add(
new Primitive({
geometryInstances: [perSegmentPolyline, perVertexPolyline],
appearance: new PerInstanceColorAppearance({
flat: true,
renderState: {
lineWidth: Math.min(5.0, m.viewer.scene.maximumAliasedLineWidth),
},
}),
})
);
//flyToBS(this.viewer, Cartesian3.fromDegrees(108.94,34.3),0.5,-45,-45, 1500)
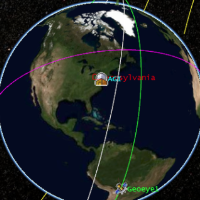
}我的数据用的项目中轨迹数据,能看到实际效果如下,线宽还需要调整一下
获取本地数据的代码如下
 loadData = function(callback) {
        var m = this
        this.positions = [];
        this.positions1 =[];
        this.colorss=[];
        this.property = new SampledPositionProperty();
        var maxvalue=70,minvalue=-20,lengths=0,i=0;
        var promise = new GeoJsonDataSource.load(caijidata);
        promise.then(function (dataSource) {
            var entities = dataSource.entities.values;
            lengths =entities.length;
            entities.forEach(e=>{
                if(e.properties.value._value>maxvalue ) maxvalue = e.properties.value._value;
                if(e.properties.value._value<minvalue ) minvalue = e.properties.value._value;
                var color = ""
                if(e.properties.value._value>=-20&&e.properties.value._value<-10){
                    color = m.colorLs[0]
                }
                if(e.properties.value._value>=-10&&e.properties.value._value<0){
                    color = m.colorLs[1]
                }
                if(e.properties.value._value>=0&&e.properties.value._value<10){
                    color = m.colorLs[2]
                }
                if(e.properties.value._value>=10&&e.properties.value._value<20){
                    color = m.colorLs[3]
                }
                if(e.properties.value._value>=20&&e.properties.value._value<30){
                    color = m.colorLs[4]
                }
                if(e.properties.value._value>=30&&e.properties.value._value<40){
                    color = m.colorLs[5]
                }
                if(e.properties.value._value>=40&&e.properties.value._value<50){
                    color = m.colorLs[6]
                }
                if(e.properties.value._value>=50&&e.properties.value._value<60){
                    color = m.colorLs[7]
                }
                if(e.properties.value._value>=60&&e.properties.value._value<70){
                    color = m.colorLs[8]
                }
                if(e.properties.value._value>=70&&e.properties.value._value<80){
                    color = m.colorLs[9]
                }

                var  lon = e.properties.x._value;
                var lat  = e.properties.y._value;
                var z = e.properties.z._value;


                var position = Cartesian3.fromDegrees(lon , lat ,420);
                console.log(i);
                var start = JulianDate.fromDate(new Date(2021, 6, 25, 16));
                var time = JulianDate.addSeconds(start, i, new JulianDate());
                var position1 = Cartesian3.fromDegrees(lon , lat );
                m.property.addSample(time, position);
                m.positions.push(position)
                m.positions1.push(position1)
                m.colorss.push(Color.fromCssColorString(color));

                /*       var geo =  m.viewer.entities.add({
                           id:"carpoint"+i,
                           position :position,
                           point : {
                               pixelSize : 8,
                               color :  Color.fromCssColorString(color),
                               disableDepthTestDistance: Number.POSITIVE_INFINITY, //不遮挡
                           }
                           // ellipsoid : {
                           //     radii : new Cartesian3(30,30,30),
                           //     // material :Color.fromCssColorString(color),
                           //     material :Color.RED,
                           // }
                       });*/
                i++;

            })
            console.log("111111max"+maxvalue+"min :"+minvalue+"all:"+lengths+"pos:"+m.positions.length);
            if(typeof callback =="function"){
                callback();
            }
        })
}


 347
347

 被折叠的 条评论
为什么被折叠?
被折叠的 条评论
为什么被折叠?
 到【灌水乐园】发言


