问题很简单,当我们在编写KERNEL的时候,分配了一个数组,那么这段数组空间是在register中,还是local memory中呢?通过几个测试,我们可以来看一下:
首先一些定义:
- #define BLOCK_SIZE 32
- #define GRID_SIZE 1
- #define ARRAY_SIZE 32
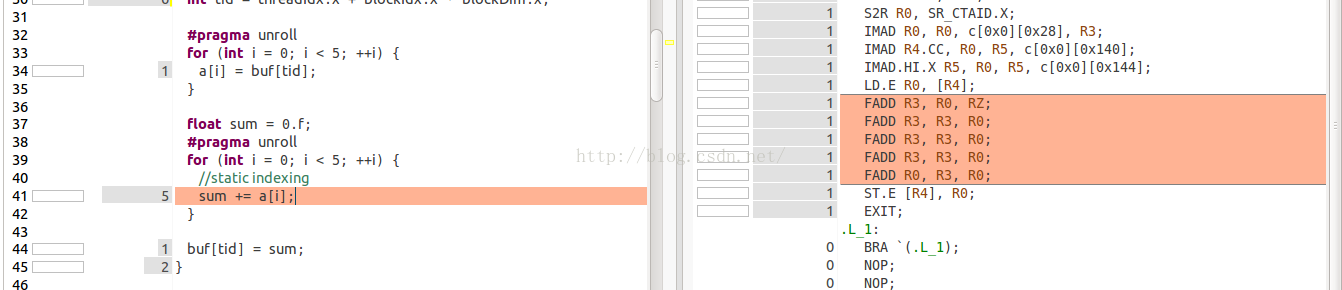
第一个kernel测试,静态索引static indexing,代码:
- __global__ void kernel1(float *buf) {
- float a[ARRAY_SIZE];
- int tid = threadIdx.x + blockIdx.x * blockDim.x;
-
- #pragma unroll
- for (int i = 0; i < 5; ++i) {
- a[i] = buf[tid];
- }
-
- float sum = 0.f;
- #pragma unroll
- for (int i = 0; i < 5; ++i) {
-
- sum += a[i];
- }
-
- buf[tid] = sum;
- }
这里,我们注意第二个for循环中,我们使用了pragma unroll展开循环,编译器将会将i优化为对应的数字0,1,2,3,4,同时,编译器也会将a[ARRAY_SIZE]优化为寄存器。我们可以通过nvvp来看一下sass代码,第41行代码对应的SASS代码只包含了5次FADD,并没有从local memory读数据的指令LDL,因此数组a是在寄存器中存储的。
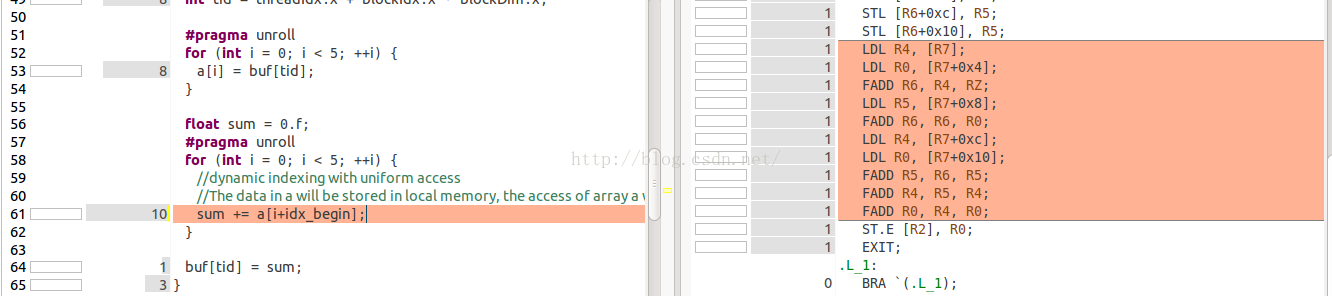
第二个kernel测试,动态索引dynamic indexing,uniform access,代码:
- __global__ void kernel2(float *buf, int idx_begin) {
- float a[ARRAY_SIZE];
- int tid = threadIdx.x + blockIdx.x * blockDim.x;
-
- #pragma unroll
- for (int i = 0; i < 5; ++i) {
- a[i] = buf[tid];
- }
-
- float sum = 0.f;
- #pragma unroll
- for (int i = 0; i < 5; ++i) {
-
-
- sum += a[i+idx_begin];
- }
-
- buf[tid] = sum;
- }
这个kernel中,数组的索引不是常量,因此编译器将不会将数组a存储到寄存器中,而是分配到了local memory中了。同样,我们可以看一下SASS代码,在FADD之前,都会利用LDL(load local memory)指令从local memory中将数据读到寄存器中。这里我们要说明一下,这里我们只分配了一个block,里面包含了32个线程。因此在GPU的SM跑的时候只有一个warp。32个线程每次读取数据时的index是一致的,因此load指令replay只有一次,这中读取方式成为uniform access。在最后,我们会使用nvprof来看看到底replay了多少次。
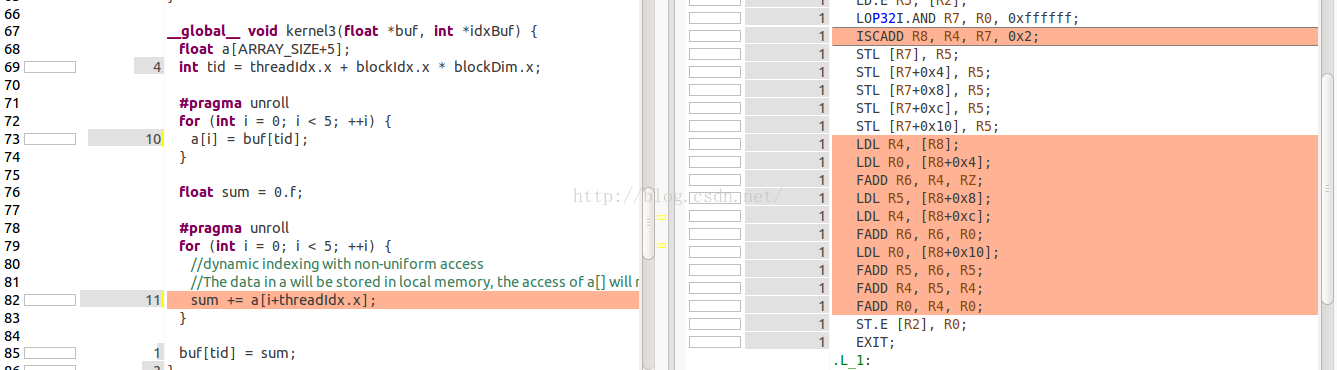
第三个kernel测试,动态索引dynamic indexing,non-uniform access,代码:
- __global__ void kernel3(float *buf, int *idxBuf) {
- float a[ARRAY_SIZE+5];
- int tid = threadIdx.x + blockIdx.x * blockDim.x;
-
- #pragma unroll
- for (int i = 0; i < 5; ++i) {
- a[i] = buf[tid];
- }
-
- float sum = 0.f;
-
- #pragma unroll
- for (int i = 0; i < 5; ++i) {
-
-
- sum += a[i+threadIdx.x];
- }
-
- buf[tid] = sum;
- }
这个kernel中,同样是动态的索引,因此数组a是在Local memory中分配的。我们可以看一下SASS代码。这里,同样要说明一下,这32个线程的索引不一致,因此从local memory中读取的时候数组不在一个cache line中,因此读操作会replay很多次。这里,32个索引各不相同,因此将会replay31次。
第四个测试,nvprof events:
为了验证我们刚才的推测(包括存储位置,读操作replay次数),这里使用nvprof来查看一些重要的指标:
- wenx@LINUX-14-04:~/work/$ nvprof --events local_load,local_store,__local_ld_mem_divergence_replays,__local_st_mem_divergence_replays ./a.out
-
- ==7893== NVPROF is profiling process 7893, command: ./a.out
- ==7893== Profiling application: ./a.out
- ==7893== Profiling result:
- ==7893== Event result:
- Invocations Event Name Min Max Avg
- Device "Tesla K20c (0)"
- Kernel: kernel3(float*, int*)
- 1 local_load 5 5 5
- 1 local_store 5 5 5
- 1 __local_ld_mem_divergence_replays 155 155 155
- 1 __local_st_mem_divergence_replays 0 0 0
- Kernel: kernel2(float*, int)
- 1 local_load 5 5 5
- 1 local_store 5 5 5
- 1 __local_ld_mem_divergence_replays 0 0 0
- 1 __local_st_mem_divergence_replays 0 0 0
- Kernel: kernel1(float*)
- 1 local_load 0 0 0
- 1 local_store 0 0 0
- 1 __local_ld_mem_divergence_replays 0 0 0
- 1 __local_st_mem_divergence_replays 0 0 0
测试结果表明:
- kernel1中,数组的索引是常量,存储到了寄存器中。
- kernel2中,数组的索引是动态的,存储到本地内存中。由于访问的index一致,因此replay为0。
- kernel3中,数组的索引是动态的,存储到本地内存中。由于访问的index都不一致(32个不同的index),因此local memory的读操作重复了31*5=155次,其中5是指循环了5次。
转载:http://blog.csdn.net/xiewen_bupt/article/details/50387370


 459
459

 被折叠的 条评论
为什么被折叠?
被折叠的 条评论
为什么被折叠?
 到【灌水乐园】发言


