


一.调用函数
1.获取数据的行数和列数
[dr,dc]=size(data) %dr,dc分别为data的行数和列数
2.获取函数的最大值和索引值
[xmax,idx]=max(data)    %xmax为data最大值,idx输出为索引值
[xmin,idx]=min(data)    %xmin为data最小值,idx输出为索引值
[~,idx]=min(data)       %仅获取data中最小值的索引值,不获取最小值
[xmax,~]=max(data)      %仅获取data中最大值,不获取最大值的索引值
例:
数据V2:
①获取最大值以及最大值索引值
[vMax,ivMax] = max(v2)
ans=10.1570  5
②获取最小值索引值
[~,identify]=min(v2)
ans=1
二.绘制数据图
- plot 函数
①语法
plot(a,b)                       %a位于x轴,b位于y轴绘图
plot(a,b,'--')                 %a位于x轴,b位于y轴,用虚线绘图
plot(a,b,'--o')                %a位于x轴,b位于y轴,用虚线和圆形标记绘图
plot(a,b,'r--o')               %a位于x轴,b位于y轴,用红色虚线和圆形标记绘图
plot(a,b,'yo')                  %a位于x轴,b位于y轴,黄色圆形标记绘图(不用线条)
plot(a,b,'--','LineWidth',3)  %a位于x轴,b位于y轴,虚线绘图,虚线宽为3)
plot(v,'o')                     %当单独绘制一个列向量,Matlab会使用向量v作为y轴数据
②符号
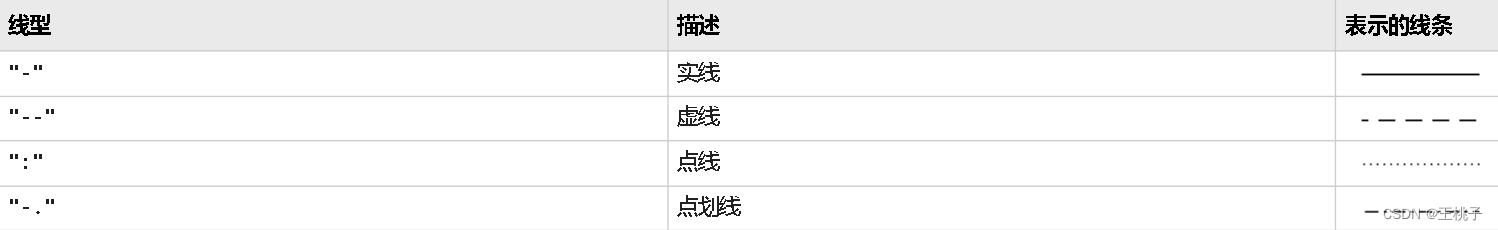
线型
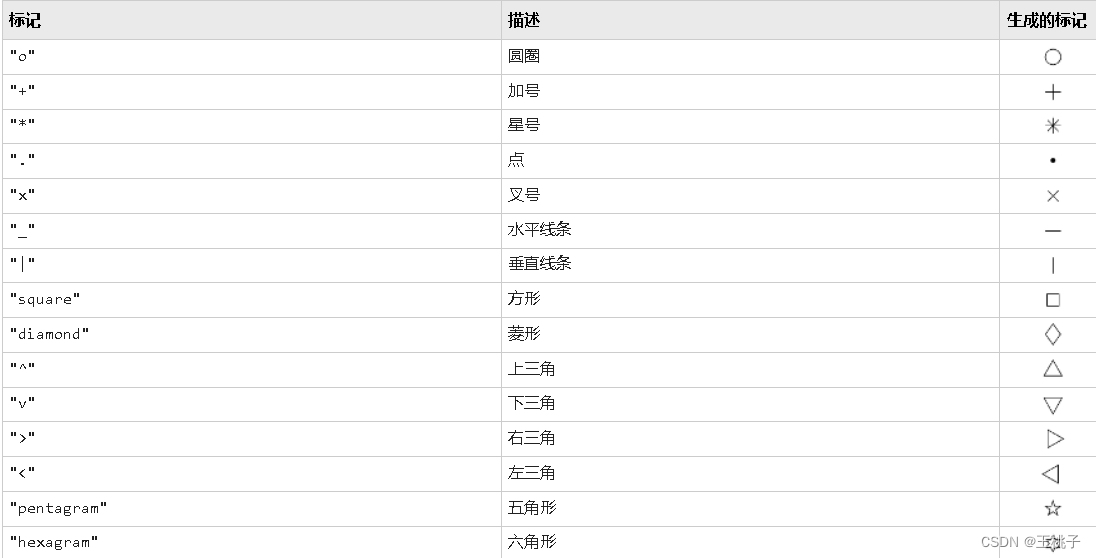
标记
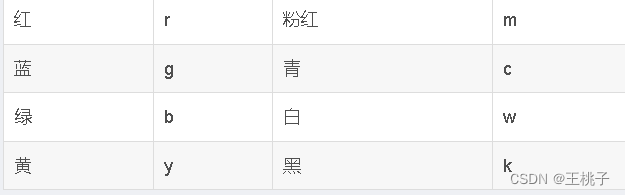
颜色
③例子
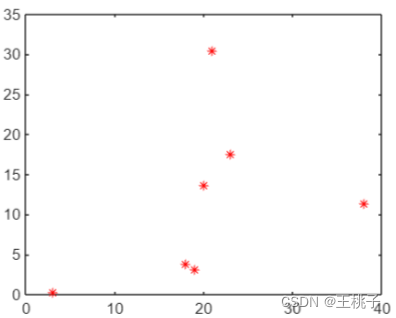
plot(sample,mass2,“r*”)
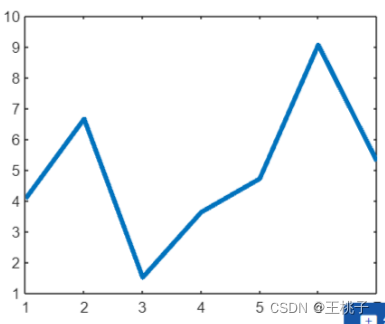
plot(v1,“LineWidth”,3)
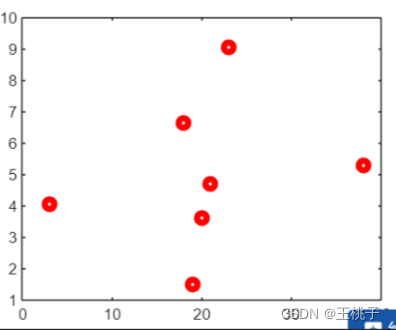
plot(sample,v1,“ro”,“LineWidth”,4)
2. hold on和hold off函数
hold on 在同一个绘图框中进行绘图
hold off 输入hold off后停止在同一个绘图框中进行绘图
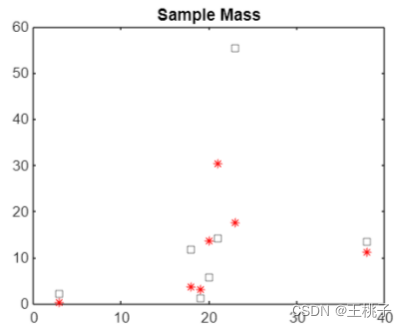
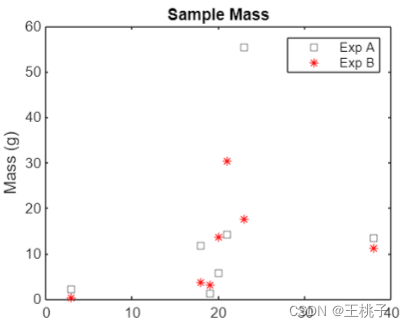
plot(sample,mass1,"ks")     %k为黑色,s为方形
hold on
plot(sample,mass2,"r*")
hold off
3. histogram直方图
histogram(X)         %基于X数据创建直方图,直方图的份数bin自动分配,然后返回均匀宽度的 bin
histogram(X,nbins)  %基于X数据创建直方图,直方图的份数为nbins
例:
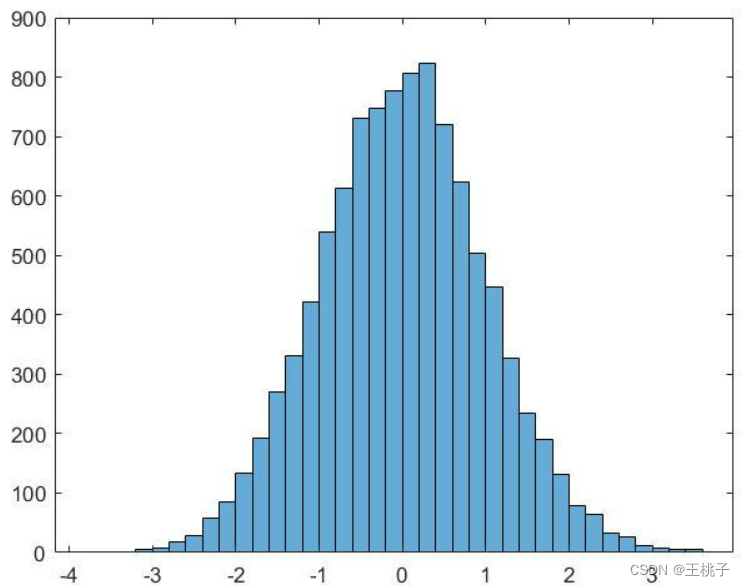
x = randn(10000,1);
h = histogram(x)
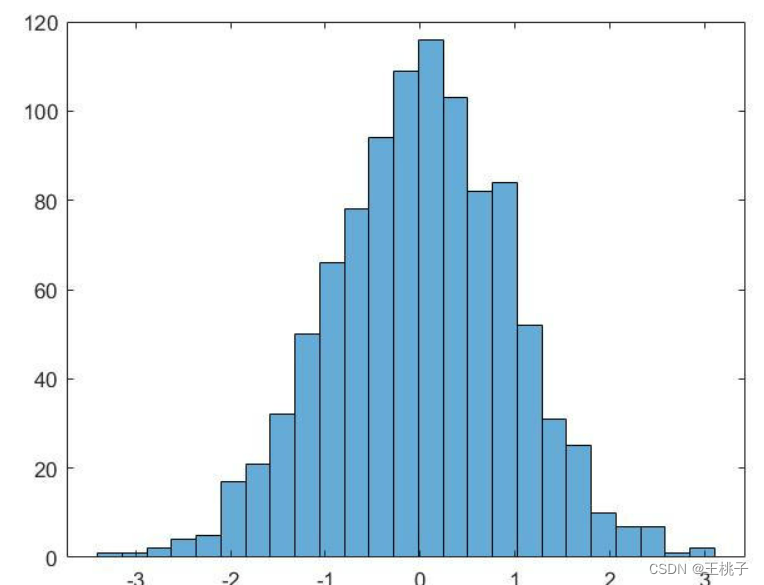
x = randn(1000,1);
nbins = 25;
h = histogram(x,nbins)
- 增加标题与图例
title("Sample Mass")       %标题为Sample Mass
ylabel("Mass (g) ")        %y轴坐标名称为Mass (g)
legend("Exp A","Exp B")    %增加图例Exp A,Exp B
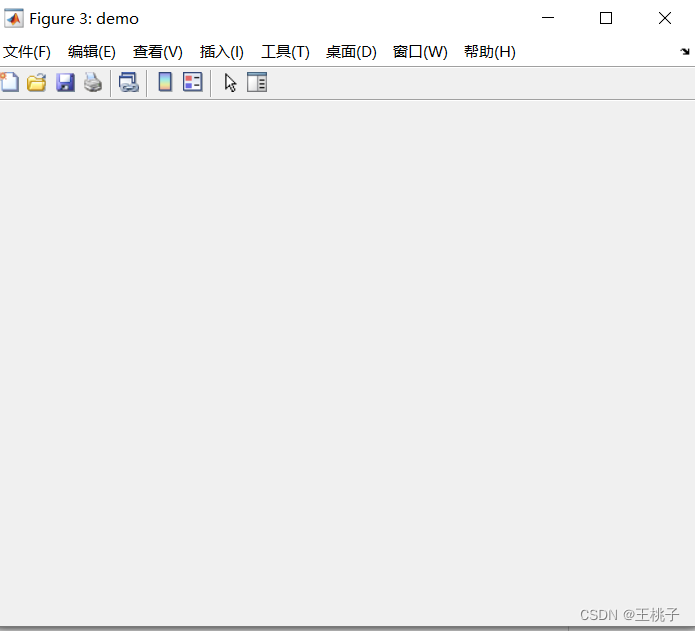
- figure 函数
①figure函数的作用为新建图框
figure(3)
figure('name','demo')   %命名图框名称
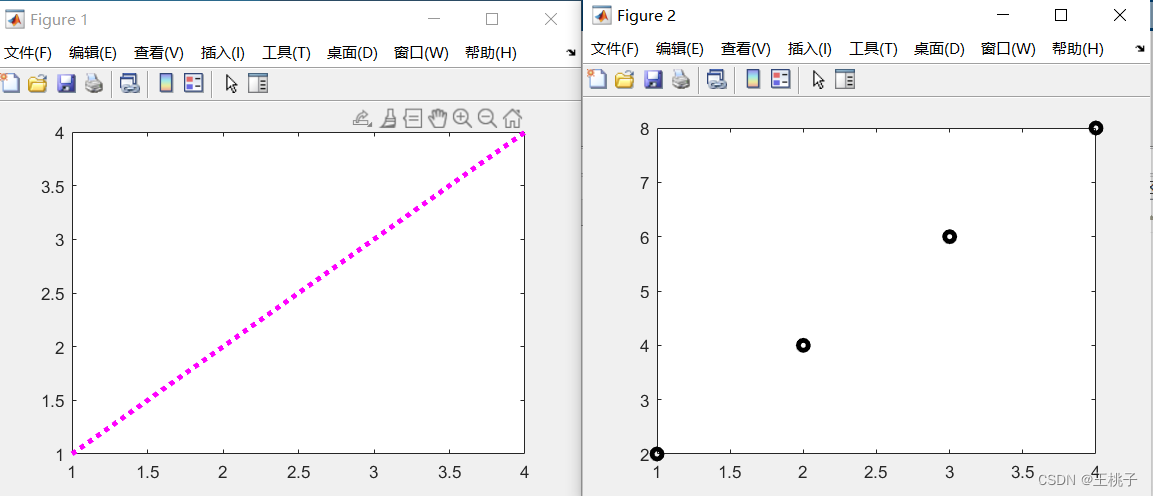
②figure函数的作用为新建图框
figure(1)         %创建图框1
x=[1,2,3,4];
y=[1,2,3,4];
plot(x,y,'m:','LineWidth',3)
figure(2)       %创建图框2
x=[1,2,3,4];
y=[2,4,6,8];
plot(x,y,'ko','LineWidth',3)
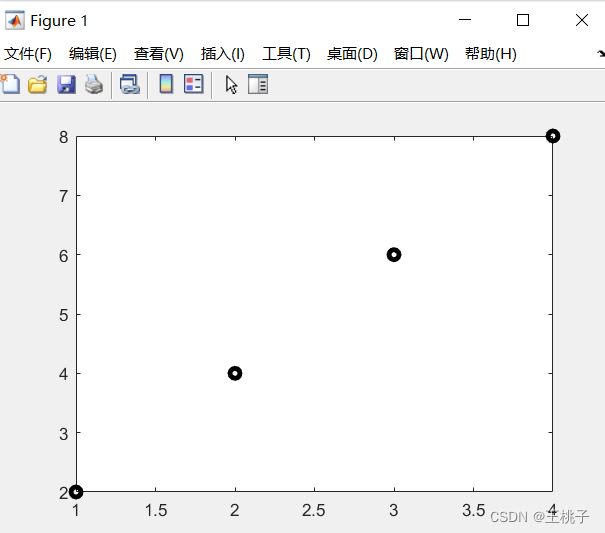
ps:对比不加figure创建图框,则输出仅会显示最新的,不会显示多个图框
x=[1,2,3,4];
y=[1,2,3,4];
plot(x,y,'m:','LineWidth',3)
x=[1,2,3,4];
y=[2,4,6,8];
plot(x,y,'ko','LineWidth',3)


 5万+
5万+

 被折叠的 条评论
为什么被折叠?
被折叠的 条评论
为什么被折叠?
 到【灌水乐园】发言


