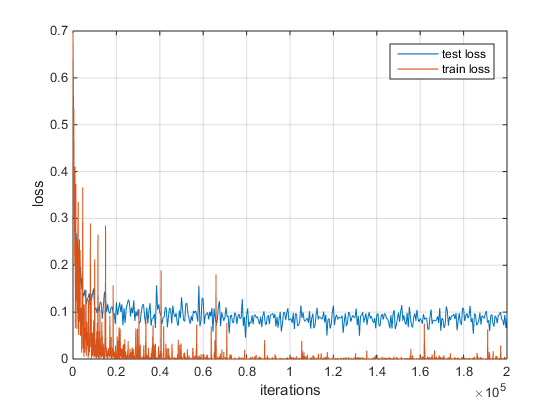
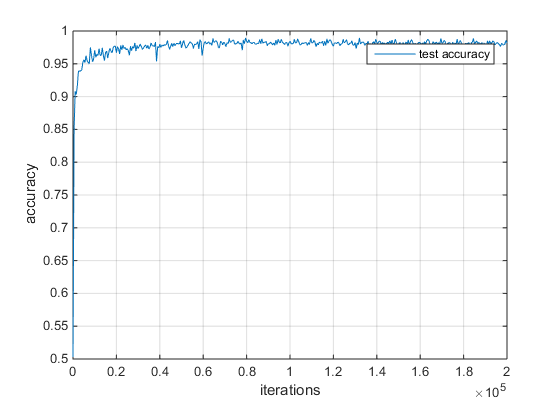
1.命令控制台输出重定向,保存训练的日志文件。
train.bat
G:
cd G:\caffe-master
set GLOG_logtostderr=1
set BIN=Build/x64/Release

"%BIN%/caffe.exe" train --solver=examples/Planthopper_test/Planthopper_solver-leveldb.prototxt

>examples/Planthopper_test/Log/net.log 2>&1
pause
2.筛选日志文件中的loss,accuracy,迭代行,并绘制曲线。
drawcurve.m
% Well, this is a function that write the
% iteration vs accurancy
% iteration vs loss
% To a file

clc;
clear;

% log file of caffe model
logName = 'net.log';

fid = fopen(logName, 'r');
fid_accuracy = fopen('output_accuracy.txt', 'w');
fid_test_loss = fopen('output_test_loss.txt','w');
fid_train_loss = fopen('output_train_loss.txt', 'w');

tline = fgetl(fid);
accur=zeros(401,1);      %max_iteration/test_interval  精度,测试损失数量
testloss=zeros(401,1);
m=1;
trainloss=zeros(2001,1);  %max_iteration/display       训练损失数量
n=1;
while ischar(tline)    %读入每一行
    % First find the accuracy line
    k = strfind(tline, 'Test net output');
    if (k)
        k = strfind(tline, 'accuracy');
        if (k)
            % If the string contain test and accuracy at the same time
            % The bias from 'accuracy' to the float number
            indexStart = k + 11; %定位到精度数值
            indexEnd = size(tline);
            str = tline(indexStart : indexEnd(2));  %读入精度

        fprintf(fid_accuracy, '%s\r\n', str);
        accur(m)=str2double(str);
        end
    end
  % next,find the test loss line
      k5 = strfind(tline, 'Test net output');
    if (k5)
        k5 = strfind(tline, 'loss');
        if (k5)
            indexStart = k5 + 7; %定位到test loss数值
            indexEnd = indexStart + 6;
            str5 = tline(indexStart : indexEnd);  %读入test loss
        fprintf(fid_test_loss, '%s\r\n', str5);
      testloss(m)=str2double(str5);
      m=m+1;
        end
    end

    % Then find the loss line
    k1 = strfind(tline, 'Iteration');
    if (k1)
       k2 = strfind(tline, 'loss');
       if (k2)
           indexStart = k2 + 7;        %定位到train loss数值
           indexEnd = size(tline);
           str1 = tline(indexStart:indexEnd(2));        %取train loss
           indexStart = k1 + 10;                     %定位到iteration
           indexEnd = strfind(tline, ',') - 1;
           str2 = tline(indexStart:indexEnd);        %取迭代序号
           res_str1 = strcat(str2, '/', str1);
           fprintf(fid_train_loss, '%s\r\n', res_str1);
           trainloss(n)=str2double(str1);
           n=n+1;
       end
    end
    tline = fgetl(fid);
end

fclose(fid);
fclose(fid_accuracy);

testidx = 0:400;
idx_test = testidx * 500;
trainidx = 0:2000;
idx_train = trainidx * 100;
figure;plot(idx_test,accur);
grid on;
legend('test accuracy');
xlabel('iterations');
ylabel('accuracy');

figure;
plot(idx_test,testloss);
hold on;
plot(idx_train,trainloss);
grid on;
legend('test loss', 'train loss');
xlabel('iterations');
ylabel('loss');
输出3个txt文件,train loss,test loss,accuracy。
绘制loss曲线和accuracy曲线。


 673
673

 被折叠的 条评论
为什么被折叠?


