


Lime-echart 是一个基于 JavaScript 的开源可视化图表库,旨在使 ECharts 图表能够在 UniApp 各个端中运行。UniApp 是一个跨平台的应用程序开发框架,允许开发人员使用 Vue.js 开发一次,然后部署到多个平台,包括 iOS、Android、Web 和各种小程序平台。
通过 Lime-echart 插件,开发人员可以轻松地将 ECharts 图表集成到他们的 UniApp 项目中,并在不同平台上呈现交互式和可视化的数据。ECharts 是一个功能强大的图表库,提供了丰富的图表类型和高度可定制的选项,使得数据可视化变得更加简单和直观。
Lime-echart 插件的主要功能包括:
-
跨平台兼容性:Lime-echart 插件可以在 UniApp 的各个端上运行,包括 iOS、Android、Web 和各种小程序平台。这意味着开发人员可以构建一次图表,然后将其部署到多个平台上,无需进行额外的适配工作。
-
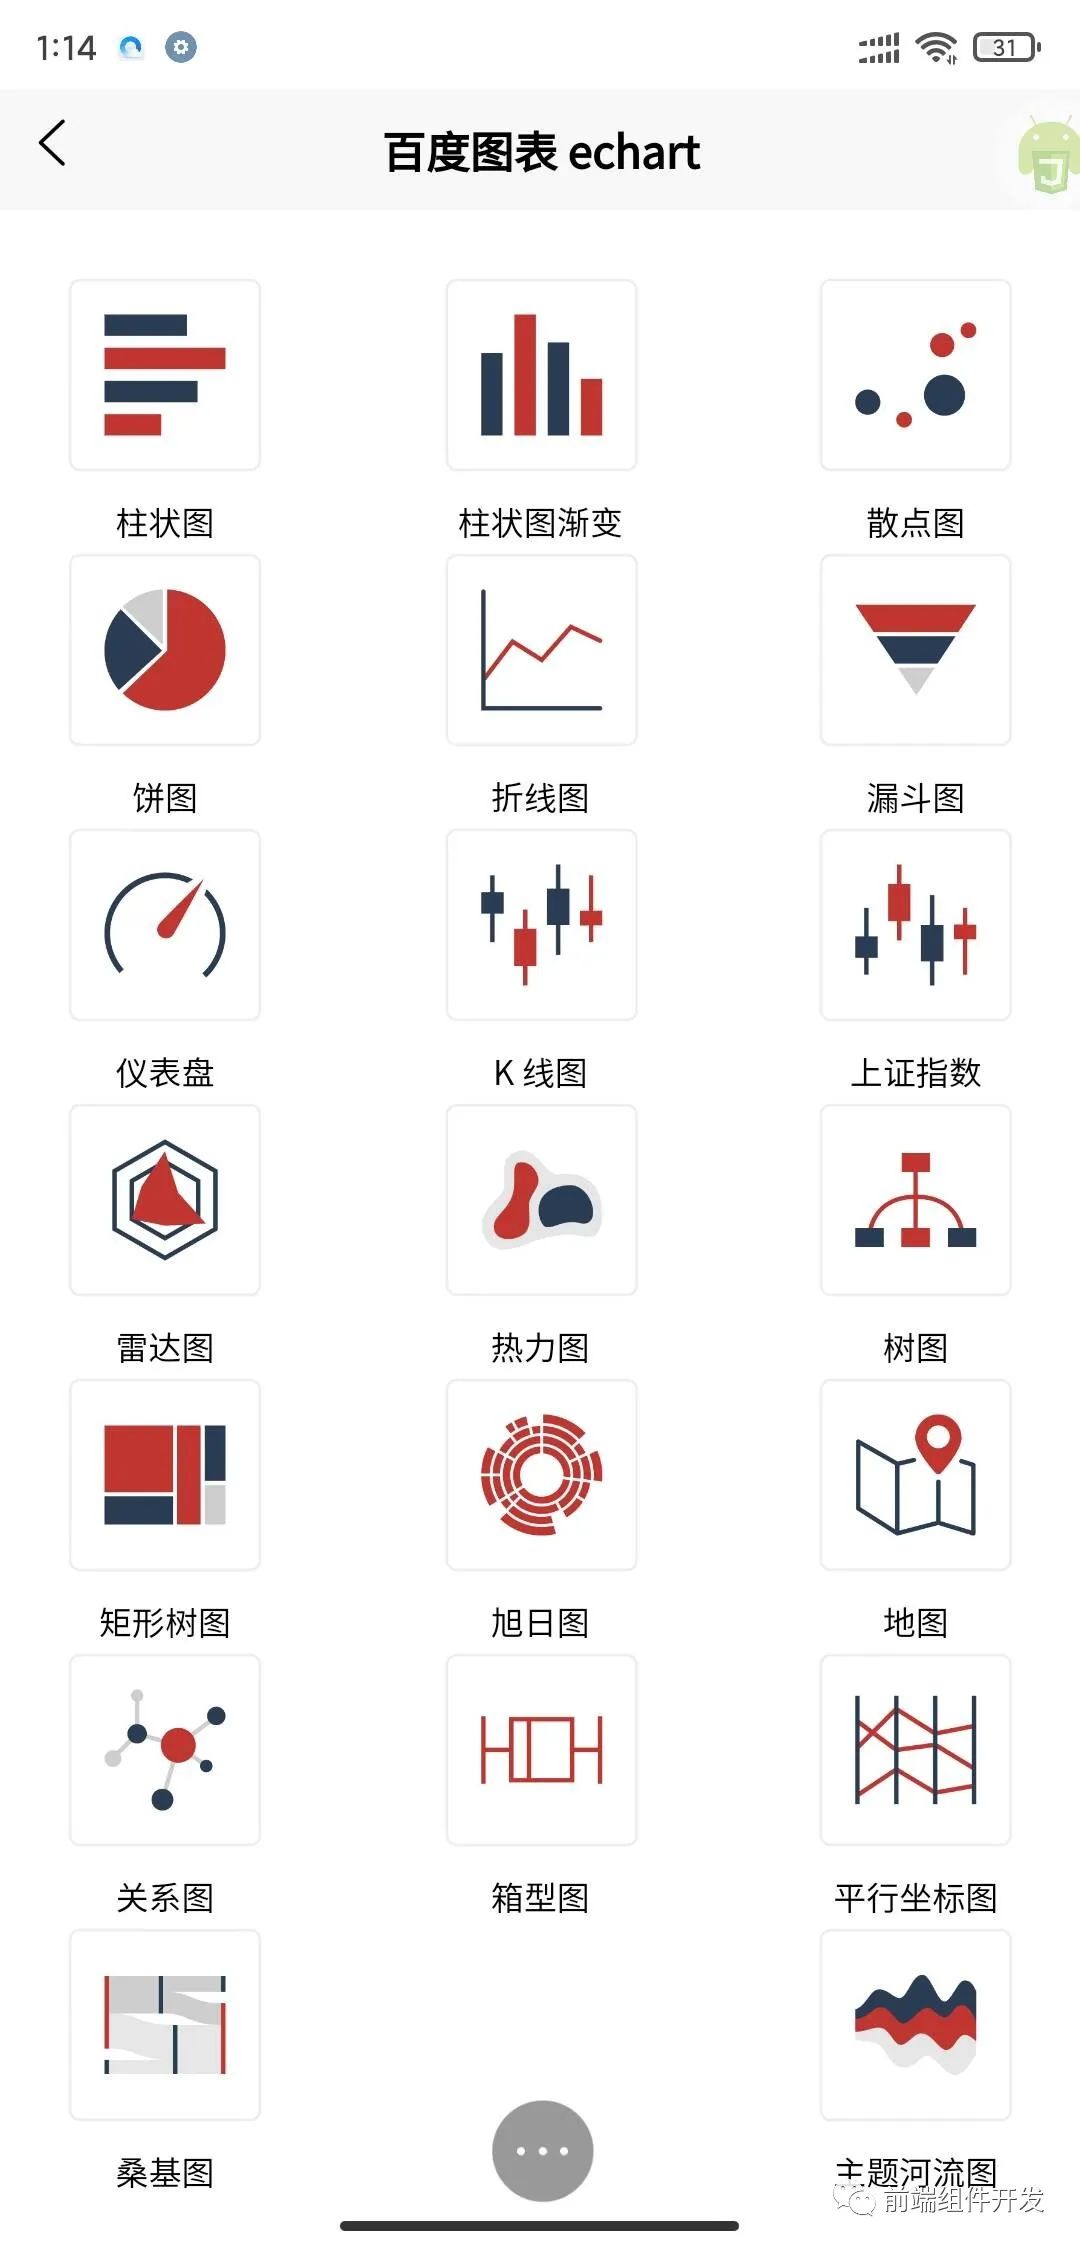
丰富的图表类型:Lime-echart 支持 ECharts 提供的各种图表类型,如折线图、柱状图、散点图、饼图等。开发人员可以根据需求选择适合的图表类型来展示数据。
-
高度可定制:Lime-echart 插件允许开发人员根据自己的需求定制图表的样式、颜色、交互等。通过 ECharts 提供的配置项,开发人员可以灵活地调整图表的外观和行为。
-
交互功能:Lime-echart 插件支持图表的交互功能,如数据区域选择、数据点点击事件等。这使得用户可以与图表进行互动,获取更详细的数据信息或触发相应的操作。
-
性能优化:Lime-echart 插件针对移动设备进行了性能优化,确保图表在不同平台上的流畅运行和快速渲染。
安装
-
第一步、在uni-app插件市场导入该插件
-
第二步、安装 echarts 或者直接使用插件内的echarts.min文件
复制代码
pnpm add echarts -or- npm install echarts
基础用法
复制代码<view><l-echart ref="chart" @finished="init"></l-echart></view>
import LEchart from '@/uni_modules/lime-echart/components/l-echart/l-echart.vue';
export default {
components: {LEchart}
}
// 方式一:自定义包
// 使用插件内提供的echarts.min
// 或在官网自定义包:https://echarts.apache.org/zh/builder.html
// 注意 插件内的包是umd格式的,如果你是vue3请使用esm格式的包 https://github.com/apache/echarts/tree/master/dist
import * as echarts from '@/uni_modules/lime-echart/static/echarts.min'
// 方式二:全量包
// 如果你使用 npm 安装了 echarts
import * as echarts from 'echarts'
// 方式三:按需引入
// 按需引入 开始
import * as echarts from 'echarts/core';
import {LineChart, BarChart} from 'echarts/charts';
import {TitleComponent,TooltipComponent,GridComponent, DatasetComponent, TransformComponent, LegendComponent } from 'echarts/components';
// 标签自动布局,全局过渡动画等特性
import {LabelLayout,UniversalTransition} from 'echarts/features';
// 引入 Canvas 渲染器,注意引入 CanvasRenderer 是必须的一步
import {CanvasRenderer} from 'echarts/renderers';
// 按需引入 注册必须的组件
echarts.use([
LegendComponent,
TitleComponent,
TooltipComponent,
GridComponent,
DatasetComponent,
TransformComponent,
LineChart,
BarChart,
LabelLayout,
UniversalTransition,
CanvasRenderer
]);
//-------------按需引入结束------------------------
export default {
data() {
return {
option: {
tooltip: {
trigger: 'axis',
axisPointer: {
type: 'shadow'
},
confine: true
},
legend: {
data: ['热度', '正面', '负面']
},
grid: {
left: 20,
right: 20,
bottom: 15,
top: 40,
containLabel: true
},
xAxis: [
{
type: 'value',
axisLine: {
lineStyle: {
color: '#999999'
}
},
axisLabel: {
color: '#666666'
}
}
],
yAxis: [
{
type: 'category',
axisTick: { show: false },
data: ['汽车之家', '今日头条', '百度贴吧', '一点资讯', '微信', '微博', '知乎'],
axisLine: {
lineStyle: {
color: '#999999'
}
},
axisLabel: {
color: '#666666'
}
}
],
series: [
{
name: '热度',
type: 'bar',
label: {
normal: {
show: true,
position: 'inside'
}
},
data: [300, 270, 340, 344, 300, 320, 310],
},
{
name: '正面',
type: 'bar',
stack: '总量',
label: {
normal: {
show: true
}
},
data: [120, 102, 141, 174, 190, 250, 220]
},
{
name: '负面',
type: 'bar',
stack: '总量',
label: {
normal: {
show: true,
position: 'left'
}
},
data: [-20, -32, -21, -34, -90, -130, -110]
}
]
},
};
},
// 组件能被调用必须是组件的节点已经被渲染到页面上
// 1、在页面mounted里调用,有时候mounted 组件也未必渲染完成
mounted() {
// init(echarts, theme?:string, opts?:{}, chart => {})
// echarts 必填, 非nvue必填,nvue不用填
// theme 可选,应用的主题,目前只支持名称,如:'dark'
// opts = { // 可选
// locale?: string // 从 `5.0.0` 开始支持
// }
// chart => {} , callback 返回图表实例
this.$refs.chart.init(echarts, chart => {
chart.setOption(this.option);
});
},
// 2、或者使用组件的finished事件里调用
methods: {
async init() {
// chart 图表实例不能存在data里
const chart = await this.$refs.chart.init(echarts);
chart.setOption(this.option)
}
}
}// 方式一:自定义包
// 使用插件内提供的echarts.min
// 或在官网自定义包:https://echarts.apache.org/zh/builder.html
// 注意 插件内的包是umd格式的,如果你是vue3请使用esm格式的包 https://github.com/apache/echarts/tree/master/dist
import * as echarts from '@/uni_modules/lime-echart/static/echarts.min'
// 方式二:全量包
// 如果你使用 npm 安装了 echarts
import * as echarts from 'echarts'
// 方式三:按需引入
// 按需引入 开始
import * as echarts from 'echarts/core';
import {LineChart, BarChart} from 'echarts/charts';
import {TitleComponent,TooltipComponent,GridComponent, DatasetComponent, TransformComponent, LegendComponent } from 'echarts/components';
// 标签自动布局,全局过渡动画等特性
import {LabelLayout,UniversalTransition} from 'echarts/features';
// 引入 Canvas 渲染器,注意引入 CanvasRenderer 是必须的一步
import {CanvasRenderer} from 'echarts/renderers';
// 按需引入 注册必须的组件
echarts.use([
LegendComponent,
TitleComponent,
TooltipComponent,
GridComponent,
DatasetComponent,
TransformComponent,
LineChart,
BarChart,
LabelLayout,
UniversalTransition,
CanvasRenderer
]);
//-------------按需引入结束------------------------
export default {
data() {
return {
option: {
tooltip: {
trigger: 'axis',
axisPointer: {
type: 'shadow'
},
confine: true
},
legend: {
data: ['热度', '正面', '负面']
},
grid: {
left: 20,
right: 20,
bottom: 15,
top: 40,
containLabel: true
},
xAxis: [
{
type: 'value',
axisLine: {
lineStyle: {
color: '#999999'
}
},
axisLabel: {
color: '#666666'
}
}
],
yAxis: [
{
type: 'category',
axisTick: { show: false },
data: ['汽车之家', '今日头条', '百度贴吧', '一点资讯', '微信', '微博', '知乎'],
axisLine: {
lineStyle: {
color: '#999999'
}
},
axisLabel: {
color: '#666666'
}
}
],
series: [
{
name: '热度',
type: 'bar',
label: {
normal: {
show: true,
position: 'inside'
}
},
data: [300, 270, 340, 344, 300, 320, 310],
},
{
name: '正面',
type: 'bar',
stack: '总量',
label: {
normal: {
show: true
}
},
data: [120, 102, 141, 174, 190, 250, 220]
},
{
name: '负面',
type: 'bar',
stack: '总量',
label: {
normal: {
show: true,
position: 'left'
}
},
data: [-20, -32, -21, -34, -90, -130, -110]
}
]
},
};
},
// 组件能被调用必须是组件的节点已经被渲染到页面上
// 1、在页面mounted里调用,有时候mounted 组件也未必渲染完成
mounted() {
// init(echarts, theme?:string, opts?:{}, chart => {})
// echarts 必填, 非nvue必填,nvue不用填
// theme 可选,应用的主题,目前只支持名称,如:'dark'
// opts = { // 可选
// locale?: string // 从 `5.0.0` 开始支持
// }
// chart => {} , callback 返回图表实例
this.$refs.chart.init(echarts, chart => {
chart.setOption(this.option);
});
},
// 2、或者使用组件的finished事件里调用
methods: {
async init() {
// chart 图表实例不能存在data里
const chart = await this.$refs.chart.init(echarts);
chart.setOption(this.option)
}
}
}插件标签
-
默认 l-echart 为 component
-
默认 lime-echart 为 demo
复制代码
// 在任意地方使用可查看domo, 代码位于/uni_modules/lime-echart/component/lime-echart <lime-echart></lime-echart>
总之,Lime-echart 是一个功能强大的插件,使开发人员能够轻松地在 UniApp 项目中集成 ECharts 图表,并实现跨平台的数据可视化。无论是构建移动应用还是小程序,Lime-echart 都能提供灵活的解决方案,满足各种数据展示需求。
下载完整组件代码请关注微信公众号: 前端组件开发


 2820
2820


 被折叠的 条评论
为什么被折叠?
被折叠的 条评论
为什么被折叠?
 到【灌水乐园】发言


